
Corporate Social Responsibility Report
At Big Yellow, we know the most important space of all is the environment that surrounds us. That’s why we continue to work hard to create an environmentally friendly business.
A big green Commitment
- 1.0
-
INTRODUCTION
Big Yellow recognises that high levels of Corporate Social Responsibility (“CSR”), linked to clear commercial objectives, will create a more sustainable business and increase shareholder and customer value. Our CSR policy covers all of our operations, as a self storage provider, a real estate developer, an employer and a participant in our local communities.
Big Yellow seeks to meet the demand for self storage from businesses and private individuals providing the storage space for their commercial and/or domestic needs, whilst aiding local employment creation and contributing to local community regeneration.
- 2.0
-
SOCIAL RESPONSIBILITY
2.1 OUR PEOPLE
Our people are at the heart of Big Yellow’s business, bringing our values to life through the service that they provide, and bringing the energy and passion that drives us to become an ever more responsible and sustainable business.
We recognise that recruiting, retaining, and motivating individuals with talent and integrity – and ensuring that we listen to our people and maximise their skills and performance – is key to the continued success of our Company.
We encourage a culture of partnership within the business and believe in staff participating in corporate performance through benefits, such as bonus schemes and share incentives. We recognise and reward the exceptional performance, achievements and ideas of our people through a Points Recognition Scheme, and awarded points worth £50,000 for the year ended 31 March 2015.
Wellbeing and Support
We aim to promote employee wellbeing through a range of flexible working options which include flexitime, staggered hours, home working and sabbaticals. We provide Childcare Vouchers along with a comprehensive range of medical support and advice though our occupational health providers. We have arranged corporate gym membership on a national basis, as well as a “Cycle to Work” scheme and employee Telephone ‘Help Line’ Assistance Programmes.
Communication and Engagement
We continue to recognise the importance of communication and consultation with an annual Conference, regular formal and informal meetings, quarterly newsletters, and weekly operational updates. In addition, the Directors and Senior Management spend a significant amount of time in the stores and are accessible to employees at all levels.
In October 2014, we ran our first externally managed Employee Engagement Survey, as we had previously carried out internal feedback surveys. The new survey was structured to look at key areas including day to day working life, learning and development, team work, communication, management style and leadership. The survey achieved a response rate of 91% (71% in 2012) and an “Engagement Indicator” of 86%. Management are now utilising the feedback from the survey as the focus for their attention to further improve the working environment at both Big Yellow and Armadillo.
Training and Development
We continue to promote the development of staff through ongoing training and regular performance appraisals. For the year ended 31 March 2015 a total of 855 days training were provided across the Company, comprising both sales and operational training and personal and management development.
Our “Big Impressions” customer experience programme continued throughout the year, with our coaching and development initiatives being specifically designed to further support our people to become more in touch with our customers.
During the last year, seven team members completed our personal development programme designed specifically for Assistant Store Managers, with four of those people having subsequently been promoted to the position of Store Manager. 12 Assistant Store Managers are currently participating in the programme, to prepare them for their future progression within the Company.
Community
We recognise the importance of contributing within the local community and we encourage our people to develop close links with charities, schools and other institutions, both locally and nationally, to help to build more economically sustainable local environments.
For the year ended 31 March 2015, we recognised and supported 15 different Company charities which were elected by our store and head office teams. Our people undertook a variety of activities for both these and other charities, with donations also being made by the Company.
Throughout the year a total of £37,000 was raised for our Company charities and £24,000 was raised for other charities.
Examples of our fundraising activities have included:
The London Marathon
One of our team members ran the London Marathon, raising £1,600 for the charity RP Fighting Blindness which supports research to find a treatment or cure for Retinitis Pigmentosa, a disease of the eye that leads to loss of vision and blindness.
“We really value the relationship we have with Big Yellow Self Storage - the organisation has a great giving ethos and their range of ideas for fundraising and palpable enthusiasm from the staff is just fantastic!
We’re delighted to have built such a solid partnership with Big Yellow and look forward to developing this further in the future. The strong community spirit and great organisational skills of all of those concerned have benefitted RP Fighting Blindness so much, and we’re extremely grateful for such support.”
Hannah Hickman, Project Fundraiser, RP Fighting Blindness
British Heart Foundation – Donation Stations
Nine of our stores have acted as “Donation Stations” for the British Heart Foundation, raising a total of just under £14,900 from bags of unwanted clothes and household goods, which will support the charity’s pioneering heart research, as well as the care of people living with heart disease.
“We are delighted with the support we have received from Big Yellow Self Storage staff and customers over the past year. We’re very grateful for the unwanted items that have been donated. By selling these in British Heart Foundation shops Big Yellow have raised money which will help fund our life saving research. It’s wonderful to have the support of Big Yellow and we are looking forward to building on an already successful partnership”
Clare Appleby, Corporate Partnerships Account Manager, British Heart Foundation
The Three Peaks Challenge
This gruelling challenge, which involved climbing Ben Nevis, Scafell Pike and Snowdon in under 30 hours, was completed by seven of our team members and they raised just under £2,600 for Cystic Fibrosis.
Free Storage
In addition to our fundraising activities for charities and worthy causes, we have also provided free storage space at most of our stores. During the year the space occupied by charities in Big Yellow and Armadillo stores on this basis was 37,800 sq ft, worth approximately £750,000 per annum at standard rents. Some of the many charities that have benefited from this free storage include the National Childbirth Trust, Cancer Research, British Heart Foundation, and a number of food bank charities and local community charities.
Young Enterprise
A number of team members within our head office and stores are currently supporting students in schools and colleges within their local communities in conjunction with Young Enterprise, a charitable organisation that creates and develops programmes that complement the school experience and encourages young people to realise the extent of their own talents. Our volunteering has taken the form of providing classroom support, mentoring students to create their own businesses and participating in Young Enterprise regional board meetings.
“For three years I have been a member of the Reading Area Board for Young Enterprise. The role of the voluntary local board members is to support Young Enterprise in delivering a learning environment for school students on the skills and roles required to lead a successful business. Using my business knowledge to guide the students in various local schools / colleges to establish and trade their companies is hugely motivating, as is the knowledge that I am supporting the development of the business skills of these young people within their local community.”
Nicola Crosby, Head of Store Operations, Big Yellow Self Storage
- We recognise the importance of contributing within the local community to help build more economically sustainable environments.
- During the year the space occupied by charities in our stores was worth approximately £750,000.
2.2 OUR HEALTH & SAFETY
Big Yellow recognises the importance of maintaining high standards of health and safety for everyone who may be affected by our business. The Group’s Health and Safety Policy (for Big Yellow Self Storage and Armadillo Self Storage) is reviewed on an ongoing basis. It is applied in two distinct areas – our construction activities and our routine store operations. The policy states that all employees have a responsibility for health and safety, but that managers have special responsibilities. Additional duties are placed on Adrian Lee, Operations Director, to keep the Board advised on health and safety issues and ensure compliance with the Policy in respect of both construction activity and store operations, respectively.
The Group has a Health and Safety Committee, which meets quarterly and comprises of Adrian Lee and appointed Department Heads and other relevant Managers. They meet to discuss any issues that have been reported from meetings held at head office, Maidenhead (our distribution warehouse), the stores and any construction sites.
In addition, the Group has appointed an external consultant to review our Policy and to perform audits of our stores on a rolling programme; to ensure the implementation of the Group’s Health and Safety policies. Any actions recommended by our consultant is then considered by the Committee and, if required, then implemented into the operations or construction systems. Health and Safety audits are also carried out by external consultants on each construction site prior to the opening of a store.
Our Health and Safety Policy covers all of our stores, our head office, Maidenhead and our ‘Fit-out’ construction sites. Incidents are recorded for staff, customers, contractors and visitors. The Board receives reports every other month which monitor Health and Safety performance in all these areas. Annual Store Health and Safety Meetings take place for all stores and Maidenhead. Agendas are provided for these meetings via the intranet from the Facilities team and the minutes are reviewed by Area Managers to raise any issues with Facilities or Human Resources where necessary.
Health and Safety performance and incidents are reported and are displayed in the tables below.
2.2.1 Big Yellow Self Storage Customers, Contractors and Visitors
The number of customer move ins, including Armadillo Self Storage, continued to increase this year by 9%, to 79,424. There were a total of 75 reported incidents this year, of which 52 were Minor Injuries sustained by customers, contractors and visitors, and 18 were Minor Incidents sustained by staff. Five of these were reportable injuries (“RIDDOR”) in total; four due to customers and one due to staff, including breaks, cuts and bruises from falls, relating to self storage activities and one personal health problem.
Store customer, contractor and visitor health and safety 2011 2012 2013 2014 2015 Number of customer move-ins
during the year51,049 57,604 65,807 72,772 79,424 Number of minor injuries 41 43 34 31 52+ Number of reportable injuries (RIDDOR) – – 3 3 4+ RIDDOR* per 100,000 – – 4.6 5.5 4.8 - +
- Indicates data reviewed by Deloitte LLP as part of their assurance work. See page 52 for the independent assurance report.
- *
- RIDDOR – Reporting of Injuries, Diseases and Dangerous Occurrences Regulation 1995.
Note – customer move-ins have included Armadillo Self Storage since 2014.
The majority of Minor Injuries were predominantly related to the handling of personal or business possessions by our customers. There were no ‘Fatal Injuries’, ‘Notices+’ or ‘Prosecutions’ during the year ended 31 March 2015.
2.2.2 Big Yellow Self Storage Staff
Store and head office staff
health and safety
Year ended 31 March2011 2012 2013* 2014 2015 Average number of staff 273 279 315 318 329+ Number of Minor Injuries 19 12 16 15 18+ Number of Reportable Injuries
(“RIDDOR”)
1
–
3
1
1+Annual injury incidence rate
(“AIIR”)* /100,000 staff
366
–
949
312
304+- +
- Indicates data reviewed by Deloitte LLP. See page 52 for their independent assurance report.
- *
- From 2013 we included Armadillo staff in our ‘Average number of staff’. In addition, following updated data, we have restated the 2014 ‘Average number of staff’, and in line with reporting assurance, corrected and restated the AIIR (Annual Injury Incidence Rate).
Staff numbers increased by 3.5% in 2015 with only one Reportable Injury. There were 18 Minor Injuries, and one reportable foot injury, relating to storage activities. There were no ‘Fatal Injuries’, ‘Notices+’ or ‘Prosecutions’. Staff, ‘Annual Injury Incidence Rate’ decreased by 2.6%, mainly due to training and increased health and safety awareness.
2.2.3 Big Yellow Construction Company Limited
During the year, Big Yellow’s new store at Gypsy Corner was opened and the Enfield stores ‘fit out works’ were completed. ‘Strip out’ works were also started at a property acquired in Cambridge. Four existing stores had Phase 2 storage partition extensions installed.
Construction fit-out contractors and
visitor health and safety
Year ended 31 March2011 2012 2013 2014 2015 Number of total Man Days 6,431 6,511 610 3,315 3,005 Number of Minor Injuries 1 1 – 2 1 Number of Reportable Injuries (RIDDOR) 1 – – – – The number of ‘Man Days’ worked was 9% less than the previous year, with our high safety standards being maintained. The Enfield site was also managed under the ‘Considerate Constructors Scheme’ (“CCS”) which also promotes high standards of health and safety management. One ‘Minor Injury’ and one ‘Near Miss’ was reported over 3,005 ‘Man Days’ in the year. No ‘Fatal Injuries’, ‘Notices’, ‘Reportable Injuries’ or ‘Prosecutions’ occurred, indicating a well-controlled environment for staff, contractors and visitors on our construction sites. Health and safety performance continues to be reviewed in preparation for our next new store development at Guildford in 2016.
A limited level of assurance is provided for our health and safety data. This assurance was undertaken by Deloitte LLP in accordance with the International Standards on Assurance Engagements 3000 (ISAE 3000).
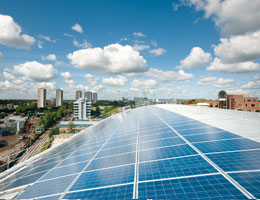
- Solar electricity generation has increased by 193% since 2011.
- Electricity use reduced by 30.8% from our 2011 peak, due to our energy efficient re-lamping and increased solar electricity generation.
- 3.0
-
ENVIRONMENTAL RESPONSIBILITY
Our Corporate Social Responsibility (“CSR”) Policy sets out how we manage the impact of our business on society and the local environment, to control our risks and manage our opportunities in a sustainable way.
Big Yellow has been classified as having a “low environmental impact” by the Ethical Investment Research Index Series (“EIRIS”) because it is involved in Support Services. Notwithstanding this, and in order to maintain an efficient and sustainable business for its Stakeholders, Big Yellow has continued to commit significant resources to the environmental and social aspects of its storage operations, real estate portfolio, new store developments and site acquisitions.
This year we report again on our energy use and in compliance with the Companies Act, Climate Change Regulation on Reporting Greenhouse Gas (“GHG”) Emissions for listed companies. For the detailed application of our report see our ‘Basis of Reporting’ at: http://corporate.bigyellow.co.uk/csr.
We therefore provide a summary in the Directors’ Report of Scope 1 (onsite gas, solar electricity generation and refrigerant use) and Scope 2 (off site power station grid supplied use) for carbon dioxide equivalent (CO2e) emissions. We have used the DEFRA DECC Version 2.1 (2014 Expiry 31 May 2015) conversion factors, for annual GHG emission calculations.

3.1 Energy Reductions from Financial Year 2011, (Peak Electricity Benchmark Year)
Our materiality threshold for energy use is 5% and for carbon emissions is > 1%. A limited level of assurance is provided for our Scope 1 and 2 energy use and GHG emissions. This assurance was undertaken by Deloitte LLP in accordance with the International Standard on Assurance Engagements 3000 (ISAE 3000).
Total Electricity and Gas Use
Year ended 31 March2011* 2012 2013 2014 2015 Electric use (kWh) 13,925,217 13,588,703 13,153,960 11,688,629 9,643,341+ Electric Reductions (%) – (2.4%) (5.5%) (16.1%) (30.8%) Gas use (kWh) 656,017 742,086 716,508 652,181 602,563 Gas Reductions (%) – +13.1% +9.2% (0.6%) (8.1%) Total Use (kWh) 14,581,234 14,330,789 13,870,468 12,340,810 10,245,904 Total Reductions (%) – (1.7%) (4.9%) (15.4%) (29.7%) **Gas Materiality % 4.5% 5.2% 5.2% 5.3% 5.8% - +
- Indicates data reviewed by Deloitte LLP. See page 52 for their independent assurance report.
- *
- The year ended 31 March 2011 is our peak total electricity and gas use benchmark for medium term assessment.
- **
- Gas materiality = > 5%.
The year ended 31 March 2015 showed electricity use reduced by 30.8% from our 2011 peak. Pre 2011, electricity use was also decreased due to the installation of energy efficient motion sensor lighting (“MSL”) and “Power Saver Fittings” on older lamps. From 2012, larger capacity (50 kWp) solar panels were installed on new stores; and from 2013, energy efficient LED lamps were installed across the whole portfolio. Gas use is variable due to winter heating demand from flexi offices at eight of our stores. This year our gas use threshold for reporting gas as a percentage of total energy use is just above the materiality level (>5%). The reductions in gas consumption were largely due to a milder winter in 2015, as flexi-office occupancy has been relatively constant over the years.
Last year we set a programme target to reduce electricity by 12% by 2015. We have reduced electricity use by 17.5% from 2014.
3.2 Mandatory GHG Emissions Statement – Summary
The ISAE 3000 Standard provides an evaluation of both quantitative and qualitative aspects of our CSR management and reporting. We report our energy use for our wholly owned stores; our head office in Bagshot, Surrey; and our packing materials warehouse in Maidenhead, Berkshire. Our environmental report does not include any of the 14 Armadillo stores, in which the Group has a 20% interest.
This year Big Yellow acquired and now wholly owns the 12 Big Yellow Limited Partnership (Joint Venture) stores, and continues to manage the buildings and utilities at these sites. In previous years we had opted to capture their energy and carbon operational footprint and have voluntarily reported this in our previous annual emissions reporting. A new store construction ‘fit out’ at Enfield was completed and we also acquired two additional existing stores at Oxford and Chester, to add to our wholly owned Big Yellow portfolio.
The year ended 31 March 2011 is our peak energy use and carbon emission benchmark year, due to a previous period of new store openings and increased occupancy. This benchmark is the best year to present information on the most comparable basis.
Scope 1 GHG emissions from our real estate portfolio (‘on site’ sources)
Scope 1 GHG emissions originate from ‘on site’ natural gas use, which is a variable use for us depending upon winter heating demand for heating flexi-offices. ‘On site’ refrigerant ‘top up’ and / or replacement, in air conditioning units is also very variable. Refrigerant use for cooling store reception areas is only ‘topped up’ when required.
Scope 1 Gas and
Refrigerant GHG Emissions
Year ended 31 March2011 2012* 2013 2014** 2015 % change
from peakGas Use (kWh) 656,017 742,086 716,508 652,181 602,563 (18.8%) Emission (tCO2e) 121.5 137.8 133.0 120.0 111.5+ (19.1%) Refrigerant Use (Kg) – 2.8 66.5 112.4 11.92 (89.4%) Emissions (tCO2e) – 4.3 286.3 354.8 20.6+ (94.2%) Total Scope 1 (tCO2e) 121.5 142.1 419.0 474.8 132.0+ (72.2%) - +
- Indicates data reviewed by Deloitte LLP. See page 52 for their independent assurance report.
- *
- 2012 peak year for gas use;
- **
- 2014 peak year for gas emissions, refrigerant emissions, and Total Scope 1 Emissions.
The direct emissions from our stores represent only approximately 5% of our combined Scope 1 and 2 emissions that are under our control. In the year ended 31 March 2015, less refrigerant replacement was required and the type used, also had a lower GHG emission conversion factor, resulting in a significant reduction in GHG Emissions. GHG emissions from flexi office gas heating are variable and reduced in the year ended 31 March 2015, due to a mild winter.
Our Scope 1 ‘onsite’ roof mounted solar panel generation (on 17 stores) provides an increasing source of annual electricity supply for newer stores.
Solar Electricity Generation Materiality
for GHG Emission Reporting
Year ended 31 March2011 2012 2013 2014 2015 Solar Generation (kWh) 107,074 134,297 208,807 285,832 314,068+ Solar % of electric use (kWh) 0.8% 1.0% 1.6% 2.4% 3.3%+ - +
- Indicates data reviewed by Deloitte LLP. See page 52 for their independent assurance report.
Solar generation has increased our self-supply to 3.3% of our total Scope 2 (Grid supplied) electricity in 2015. We have set a target last year of 5% self-supply, but this has not yet been achieved due to the opportunity to invest in more efficient LED re-lamping at our stores. However, we did generate more than our 10% target (+12.5%) of solar electricity (314,068 kWh), as a percentage of the sixteen solar stores Grid supplied electricity (2,505,045 kWh). Low carbon solar electricity reduces our GHG emissions but is still below the materiality threshold of > 5% of Scope 1 and 2 energy use combined (3.1%) for annual reporting requirements.
Scope 2 Offsite ‘Grid Supplied’ Electricity and Emissions
This electricity supply from ‘off site’ power station emissions remains at around 95% of our annual energy consumption, in the year ended 31 March 2015.
Scope 2 ‘Grid Supplied’ Electricity GHG Emissions
Year ended 31 March2011* 2012 2013 2014 2015 % change from peak Electric use (kWh) 13,925,217 13,588,703 13,153,960 11,688,629 9,643,341+ (30.8%) Emissions (tCO2e) 6,758 6,143 6,051 5,207 4,776+ (29.3%) - +
- Indicates data reviewed by Deloitte LLP. See page 52 for their independent assurance report.
- *
- Peak energy use and benchmark year for future reductions.
Electricity use has reduced by 30.8% and Scope 2 GHG emissions have reduced by 29.3%. This reduction is due to our continued investments in energy efficient technologies, such as LED re-lamping and larger capacity roof top solar installations at our new stores.
Our annual average carbon emission reduction over the last four years has been around 7% per year, double what the commercial property sector needs to do to meet the UK Government’s GHG emissions reduction target of 34% by 2020 (or 3.5% per year to 2050). Over a seven year period, from our longer term peak electricity use benchmark (2008), our GHG emission reductions have averaged around 4% per year, and were mainly reduced by earlier motion sensor lighting, power saver fitting to lighting and small scale renewable energy trails.Total Scope 1 + 2 Emissions
In the year ended 31 March 2015 total Scope 1 and 2 GHG emissions achieved a reduction of 28.7% from peak energy use in 2011, exceeding our target of 25% from last year’s report.
Total GHG
Emission reductions
Year ended 31 March2011 2012 2013 2014 2015 % change
from peak
yearScope 1 Totals 121.5 140.6 419.0 474.8* 132.0+ (72.2%) Scope 2 Totals 6,758.0 6,143.0 6,051.0 5,207.0 4,776.0+ (29.3%) Total (tCO2e) 6,879.5* 6,283.6 6,470.0 5,681.8 4,908.0+ (28.7%) - +
- Indicates data reviewed by Deloitte LLP. See page 52 for their independent assurance report.
- *
- Peak energy use and benchmark year for medium term performance assessment.
There results were mainly due to the significant reductions in Scope 2 supplied electricity emissions. Our energy use strategy of reduction, efficiency and low carbon solar generation has reduced our annual energy costs and carbon taxation by proportional percentages. It has also created an income from energy company payments for generation and exporting excess electricity to the Grid for “deemed” export payments.
GHG Emission Intensity, (Scope 1 + 2)
Key emission intensity indicators can be assessed by taking into account annual growth using customer occupancy and revenue, both of which includes new store portfolio growth.
GHG Emission Intensity (tCO2e) / Occupied Space (m2) And Revenue (£000)
Year ended 31 March2011* 2012 2013 2014 2015 % change
from peak
2011Total (tCO2e) 6,879.5* 6,283.6 6,470.0 5,681.8 4,908.0+ (28.7%) Occupancy (m2) 197,884 228,356 244,521 263,101 283,732 43.4% kgCO2e / Occupancy 24.8 27.5 26.5 21.6 17.3+ (30.6%) Revenue (£000) 61,885 65,663 69,671 72,196 84,276 35.9% kgCO2e / £ Revenue 0.11 0.10 0.09 0.08 0.06+ (45.5%) - +
- Indicates data reviewed by Deloitte LLP. See page 52 for their independent assurance report.
- *
- Peak GHG emissions year.
Over the medium term, from our peak electricity use in 2011, kgCO2e emissions have reduced per customer occupied space by 30.6% and 45.5% per revenue.
Our future GHG carbon reduction programme is to assess further LED re-lamping and low carbon solar electricity generation investments where viable.
3.3 Emission Reduction Targets
Year ended 31 March 2011* 2012 2013 2014 2015 2016 2017 2018 Emissions tCO2e 6,758 6,143 6,051 5,207 4,776+ 4,537 4,310 4,095 % reductions – -9% -10.5% -23.4% -29.3% -32.9% -36.2% -39.4% - +
- Indicates data reviewed by Deloitte LLP. See page 52 for their independent assurance report.
- *
- Peak Electricity use year.
Our future programmes for continuing re-lamping stores internally and externally with energy efficient LED lighting is to be reviewed during the year ending 31 March 2016. Additional investment in solar PV installations at our new and existing stores will also be assessed in the year ending 31 March 2016. Our target is to reduce our GHG emissions from peak energy use in 2011, by 39% in 2018.
- 4.0
-
SCOPE 3 VOLUNTARY SUPPLY CHAIN EMISSIONS
GHG Emissions
Scope 3 supply chain emissions represent GHG emissions during electricity supplier transmission and distribution to our stores.
Scope 3 Electric Supply and Distribution GHG
Emission Losses
Year ended 31 March2011* 2012 2013 2014 2015 % change
from 2011Electric use (kWh) 13,925,217 13,588,703 13,153,960 11,688,629 9,643,341+ (31.8%) Scope 2 (tCO2e) 6,758 6,143 6,051 5,207 4,776+ (28.0%) Scope 3 (tCO2e) 544 525 501 445 417** (23.4%) Total (tCO2e) 7,302 6,668 6,552 5,652 5,193 (28.9%) - +
- Indicates data reviewed by Deloitte LLP. See page 52 for their independent assurance report.
- *
- Peak energy use and benchmark year.
- **
- Transmission and Distribution Conversion Factor 2015 (0.04322).
Our energy efficiency programmes within our stores have reduced electricity demand and emission from our supplier’s power stations. Transmission and distribution losses have reduced by 23.4% since 2011. In total, Scope 2 and 3 emissions have reduced by 28.9% since 2011, compared to a 22.6% reduction last year.
Scope 3 Store Waste Supply Chain Recycling and Landfill GHG Emissions
Year ended 31 March2011 2012 2013 2014 2015 Waste Recycling (t) 266 263 259 265 273 Landfill waste (t) 37.3 36.8 34.6 37.0 38.2 Landfill GHG tCO2e* 10.8 10.7 10.0 10.7 11.0 - *
- FY 2015 Landfill gas conversion factor = 0.2892.
Waste generation in self storage is assessed as a “low environmental impact”. The majority of non-hazardous bulk office waste is segregated by our staff and then further recycling by our waste contractor takes place after collection. This year 86% of our waste was recycled and 14% went to landfill. Landfill GHG emissions are estimated to be 11.0 tCO2e. These emission levels represent a negligible percentage of our combined Scope 1 and 2 emissions, well below the materiality threshold for carbon emissions.
New Store Construction ‘Fit-Out’
Waste Management Performance
Year ended 31 March2011 2012 2013 2014 2015 Tonnage 147.5 152.3 12.9 78.9 14.5 Waste Recycled (%) 93.2 96.0 100 95 100 Plasterboard Recycled (%) 100 34.0 – 100 100 In January 2015, our new Enfield store ‘Fit Out’ contractors recycled 100% of our waste (14.5 tonnes) as follows: hard-core (38.3%); soil (26.7%); ‘waste to energy’ (15.5%); wood (9.3%); metal (4.4%); concrete (3.9%); plaster-board (2.0%) and residual cardboard and paper. All of our new stores sign up to the ‘Considerate Constructors Scheme’, and aim for high Energy Performance Certification (EPC ‘B’ rating).
Water use has been assessed as a “low environmental impact” for self storage (28,486 m3). Our data has provided an average of 20.3 tCO2e emissions per year. This represents less than 0.4% of combined Scope 1 and 2 emissions, which is below the materiality threshold for carbon emissions. Water use monitoring will be continued in order to review water use efficiency.
- 5.0
-
STAKEHOLDERS
Big Yellow engages with its main stakeholders to provide information and gain useful feedback from a variety of groups, as described below.
Government Legislation and Standards
EU Energy Efficiency Directive, The UK Energy Savings Opportunities Scheme (“ESOS”)
ESOS is enforced by the Environment Agency (“EA”) and involves reporting our annual energy savings once every four years in order to identify cost effective energy saving measures. Big Yellow is required to comply with the ESOS scheme as we are ‘a large undertaking’ (> 250+ employees) and have an annual turnover of > €50 million. We have appointed an accredited assessor, measured all our energy consumption, determined significant areas of use and will complete the audit before December 2015.
Climate Change Act 2008; Carbon Reduction Commitment (“CRC”) Tax Reporting
The Department of Energy and Climate Change (“DECC”) and the Environment Agency (“EA”) are stakeholders in the policy for reducing energy demand from large private sector organisations (energy use > 6,000 MWh / year).
The Carbon Reduction Commitment (“CRC”) Tax Reporting
Year ended 31 March2013 2014 2015 Electric Use (kWh) 13,153,960 11,688,629 9,643,341+ Gas Use (kWh) 716,508 652,181 602,563 Carbon (tCO2) 7,598 6,415 4,784 Tax Rate (£ / tCO2) £12.00 £12.00 £16.40 CRC Tax (£) £91,176 £76,980 £78,464 - +
- Indicates data reviewed by Deloitte LLP. See page 52 for their independent assurance report.
The scheme uses carbon dioxide (CO2) conversion factors, and so is not directly comparable to the Companies Act GHG reporting. The current CRC Tax Rate has risen from £12.00 to £16.40 per ton of CO2 for 2015; this will rise again in 2016 to £16.90/tCO2). The CRC is another financial driver for energy and carbon emission reductions and for investing in energy efficient technologies. From 2013, we have reduced CRC tCO2 carbon emissions by 37% and an average of 18.5% per year and are reducing CRC tax payments against future increase in the tax rate. Last year we set a programme target to reduce CRC carbon emission by 10% and we have exceeded this with a reduction of 25.4% from 2014.
UK Government Climate Change Act (2008)
National Target to Reduce GHG (tCO2e) Carbon Emissions by 34% by 2020
As part of the UK commercial property sector, Big Yellow has been reducing its energy use by energy efficient technology since its first electricity peak use in 2008.
Big Yellow Electricity
Use (kWh) Long Term
Peak Use Benchmark
Year ended 31 March2008* 2009 2010 2011 2012 2013 2014 2015 %
change
from
2008kWh 13,899,604 12,866,186 12,730,855 13,925,217 13,588,703 13,153,960 11,688,629 9,643,341+ (30.6%) tCO2e 6,487 6,383 6,287 6,758 6,143 6,051 5,207 4,766+ (26.5%) - +
- Indicates data reviewed by Deloitte LLP. See page 52 for their independent assurance report.
- *
- In 2008 the Government set a national target to reduce carbon emissions by 80% by 2050 (against a 1990 base line).
Considering approximately 95% of our ‘material’ energy use is Grid supplied electricity, we can estimate an absolute carbon reduction from 2008, of 27%. We can also estimate over the last seven years, an annual average reduction of approximately 4% per year. The UK commercial property sector ‘Real Estate Environmental Benchmark’ recommends a 3.5% annual reduction target to align with the Government’s 2050 goal set in 2008. Our more immediate target is to reduce emissions by 34% by 2020. Last year we set a programme target to reduce electricity and GHG tCO2e by 12 %. We have reduced electricity use by 17.5% and GHG tCO2e emissions by 8.5% from 2014.
Investor Communications
The Carbon Disclosure Project (“CDP”) 2014
The CDP is a global initiative by investors designed to encourage companies and their suppliers to publish information on their carbon emissions and climate change strategies.
Big Yellow CDP Performance 2010 2011 2012 2013 2014 Disclosure Score 65 – 67 71 85 Performance Score B – C D B Number of Investors 534 – 655 722 799 Note 1: we did not enter CDP in 2011.
Note 2: CDP score – a higher number is good.
Reporting Transparency Disclosure Score
Our disclosure scores have improved from 2010 and last year the CDP Corporate Environmental Report for ‘Financials’ ranked us within the upper quartile of 73 companies’. Only 7 ‘A’ rated ‘Financials’ were ranked above Big Yellow. Last year we set a program target to improve upon our 2013 our ‘Disclosure Score’ of 71 and achieved 85/100 for ‘reporting transparency’ which improved by 20% and the 2014 score was also above the Financials average of 82/100. Our scores were also above the 75/100 average for all other sectors.
Addressing Climate Change Performance Rating
Our ‘B’ Band performance rating for ‘how we are addressing climate change’ was also above the average ‘C’ Band for ‘Financials’ and other sectors. Big Yellow’s ‘number of investors’ has also been increasing by approximately 10% per year since 2010.
The Global Real Estate Sustainability Benchmark (“GRESB”)
‘Green Star Status’
GRESB collects information regarding the sustainability performance of property companies and funds. This includes information on performance indicators, such as energy, GHG emissions, water and waste. The Survey also covers broader issues such as sustainability risk assessments, performance improvement, and engagement with employees, customers, suppliers and the community. GRESB continued to rate Big Yellow with a ‘Green Star Status’ in 2014.
‘Top Quartile’ Management and Policy
In Europe and globally, we were ranked with sustainability scores in the top quartile of ‘management and policy’ and ‘implementation and measurement’. The benchmark results allow us to identify the areas we can improve, both in absolute terms and relative to our peers. We are able to provide our existing and potential investors with information regarding our Environmental and Social Governance performance, in the current real estate investment market.
- 6.0
-
CSR PROGRAMME FOR THE YEAR ENDING 31 MARCH 2016
Big Yellow will continue to focus on its most significant environmental and financial aspects of its business impact, energy use and carbon emissions. Energy efficiency and low carbon supply programmes have been trialled and have been implemented since 2008. We will review and consider further energy reduction strategies within our store operations for carbon and financial savings. This year our programmes, objectives and targets are highlighted in the table below.
CSR Strategy
Programme Performance against
Peak kWh / CO2e / CO2 / £2016 Objectives and Targets
From 2011 BenchmarkMandatory Greenhouse
Gas Emission Reduction
by Energy EfficiencyAssess remaining store portfolio energy efficient LED kWh / tCO2e
re-lamping program viability
(-28%, 2015).Remaining reception and external areas for LED re-lamping programme target of -33%, 2016. Carbon Reduction Commitment (CRC) by carbon and tax Review potential tax reduction from initial 2013 CRC tax year, based on kWh Reductions and £ CRC tax (-14%, 2015). Reduce night time internal and external ‘lighting on’ hour settings for a reduction target (-5%, 2016). Increase Solar Energy
Generation
and RevenueSolar electricity generation and revenue to increase with new portfolio additions of solar installations and selected retrofit from first Feed in Tariff year (measured from 107,074 kWh 2011). New Solar generation on Enfield and Cambridge to generate (+19%), from (2015) 314,068 kWh to 374,975 kWh (2016). FTSE4 Good Investor Environmental, Social, Governance positioning Provide data on: Governance; Risk; Tax; Bio-diversity; Community; Climate Change; Health & Safety (public domain). Maintain position in the FTSE4 Good Index Series ratings by providing links
for analyst review.Carbon Disclosure Project (CDP) Investor Communications Use our carbon data in the CDP survey 2015, to improve on ratings: ‘85’ (%) for ‘carbon reporting transparency’; and a ‘B’ rating for ‘Climate Change’ strategy. To increase or maintain our high score (85% +) and rating ‘A’ / ‘B’, and interest form a wider range of investors. Global Real Estate Sustainability Benchmark In Europe and globally, we were ranked with sustainability scores in the top quartile of ‘management and policy’ and ‘implementation and measurement’. Strengthen and maintain the leading ‘Green Star’ position in the ‘upper quartile’ of the GRESB quadrant. Health and Safety Maintain current high standards of recording and reporting customer, staff, visitor, and contractor incidents. Invest in continued training of staff in routine health and safety. Staff and CSR awareness Continue raising CSR awareness through presentation of energy performance improvements. Regular staff meetings and information bulletins on CSR progress. More details of CSR policies, previous reports and awards can be found on our investor relations web site at www.corporate.bigyellow.co.uk/csr.aspx
Assurance statement
Independent assurance statement by Deloitte LLP (“Deloitte”) to Big Yellow Group PLC (“Big Yellow”) on their Corporate Social Responsibility Report 2015 (“Report”)
What we looked at: scope of our work
Big Yellow engaged us to perform limited assurance procedures on selected corporate social responsibility (CSR) performance indicators for the year ended 31 March 2015. The assured data are indicated by the + symbol in the Report.
Carbon footprint indicators:
- >
- Store electricity (tCO2e)
- >
- Store flexi-office gas emissions (tCO2e)
- >
- Refrigerant emissions (tCO2e)
- >
- Absolute carbon dioxide emissions (tCO2e)
Store electricity use, CO2 emissions and carbon intensity:
- >
- Electricity use (kWh)
- >
- Absolute carbon emissions (tCO2e)
- >
- Carbon intensity (kgCO2e/m2 gross internal area)
- >
- Carbon intensity (kgCO2e/m2 occupied space)
- >
- Carbon intensity (kgCO2e/£ revenue)
Renewable energy generation and CO2 emissions reductions:
- >
- Total renewable energy (kWh)
- >
- Carbon dioxide saved by renewable energy (tCO2e)
- >
- Renewable energy percentage of total store use (%)
Staff health and safety:
- >
- Average number of employees
- >
- Minor Injuries
- >
- Reportable injuries (RIDDOR)
- >
- Annual Injury Incidence rate (AIIR) per 100,000 staff
- >
- Notices
What we found: our assurance opinion
Based on the assurance work we performed, nothing has come to our attention that causes us to believe that the selected CSR performance indicators, as noted above, are materially misstated.
What standards we used: basis of our work and level of assurance
We carried out limited assurance in accordance with the International Standards on Assurance Engagements 3000 (ISAE 3000). To achieve limited assurance ISAE 3000 requires that we review the processes and systems used to compile the areas on which we provide assurance. It does not include detailed testing of source data or the operating effectiveness of processes and internal controls. This is designed to give a similar level of assurance to that obtained in the review of interim financial information.
The evaluation criteria used for our assurance are the Big Yellow definitions and basis of reporting as described at: http://corporate.bigyellow.co.uk/csr.aspx
What we did: our key assurance procedures
Considering the risk of material error, our multi-disciplinary team of CSR assurance specialists planned and performed our work to obtain all the information and explanations we considered necessary to provide sufficient evidence to support our assurance conclusion. Our work was planned to mirror Big Yellow’s own group level compilation processes, tracing how data for each indicator within our assurance scope was collected, collated and validated by corporate head office and included in the Report.
Key procedures we carried out included:
- >
- gaining an understanding of Big Yellow’s systems through interview with management responsible for CSR management and reporting systems at corporate head office;
- >
- reviewing the systems and procedures to capture, collate, validate and process data for the assured performance data included in the Report. We did not test back to source data; and
- >
- reviewing the content of the 2015 CSR Report against the findings of our work and making recommendations for improvement where necessary.
Big Yellow’s responsibilities
The Directors are responsible for the preparation of the Report and for the information and statements contained within it. They are responsible for determining the CSR goals, performance and for establishing and maintaining appropriate performance management and internal control systems from which the reported information is derived.
Deloitte’s responsibilities, independence and team competencies
Our responsibility is to independently express a conclusion on the performance data for the year ended 31 March 2015. We performed the engagement in accordance with Deloitte’s independence policies, which cover all of the requirements of the International Federation of Accountants Code of Ethics and in some cases are more restrictive. We confirm to Big Yellow that we have maintained our independence and objectivity throughout the year, including the fact that there were no events or prohibited services provided which could impair that independence and objectivity in the provision of this engagement.
This report is made solely to Big Yellow in accordance with our engagement letter. Our work has been undertaken so that we might state to the company those matters we are required to state to them in an assurance report and for no other purpose. To the fullest extent permitted by law, we do not accept or assume responsibility to anyone other than Big Yellow for our work, for this report, or for the conclusions we have formed.
Deloitte LLP
London, United Kingdom
18 May 2015