
Our Strategy and Business Model
Our Strategic Report discusses the following areas:
- Our strategy and business model
- Operational and marketing review
- Store performance
- Financial review
- Principal risks and uncertainties
- Going concern basis and viability statement
- Corporate social responsibility
Approval
This report was approved by the Board of Directors on 23 May 2016 and signed on its behalf by:
James Gibson
Chief Executive
John Trotman
Chief Financial Officer
Our strategy from the outset has been to develop Big Yellow into the market leading self storage brand, delivering excellent customer service, with a great culture and highly motivated employees. We continue to be the market leading brand, with unprompted awareness of over six times that of our nearest competitor (source: YouGov survey, April 2016). We concentrate on developing our stores in main road locations with high visibility, where our distinctive branding generates high awareness of Big Yellow. Our recent accreditation in the Best 100 Companies to work for is pleasing as an independent assessment of our employee engagement, and our customer satisfaction survey scores remain very high, with an average net promoter score of over 70%, and average customer satisfaction scores of 9.3 out of 10.
Self storage demand from businesses and individuals at any given store is linked in part to local economic activity, consumer and business confidence, all of which are inter-related. Fluctuations in housing activity whether in the rented or owner occupied sector, are also a factor and in our view influence the top slice of demand over and above a core occupancy. This has been demonstrated by the resilience of our like-for-like stores since September 2007 despite a collapse in housing activity and GDP over the period 2007 to 2009. As can be seen from the ten year summary, the performance of our stores was relatively resilient during the downturn, and within that London and the South East proved to be less volatile.
Local GDP and hence business and housing activity are greatest in the larger urban conurbations and in particular London and the South East, from where we derive 80% of our revenue. Furthermore, people and businesses are space constrained in these more densely populated areas. Barriers to entry in terms of competition for land and difficulty around obtaining planning are also highest in more urbanised locations. Over the last 17 years we have built a portfolio of 73 Big Yellow self storage centres, largely freehold, purpose-built and focussed on London, the South East and large metropolitan cities. 63% of our current store revenue derives from within the M25; for London and the South East, the proportion of current store revenue is 80%.
Our Big Yellow stores are on average 63,000 sq ft, compared to an industry average of approximately 43,000 sq ft (source: The Self Storage Association 2016 UK Annual Survey). The upside from filling our larger than average sized stores is, in our view, only possible in large metropolitan markets, where self storage demand from domestic and business customers is the highest. As the operating costs of our assets are relatively fixed, larger stores in bigger urban conurbations, particularly London, drive higher revenues and higher operating margins.
We continue to believe that the medium term opportunity to create shareholder value will be principally achieved by increasing occupancy and rental yield in our existing platform to drive revenue, the majority of which flows through to the bottom line.
Our key objectives remain:
- >
- leveraging our market leading brand position to generate new prospects, principally from our digital, mobile and desktop platforms;
- >
- focusing on training, selling skills, and customer satisfaction to maximise prospect conversion and referrals;
- >
- growing occupancy and net rent so as to drive revenue optimally at each store;
- >
- maintaining a focus on cost control, so revenue growth is transmitted through to earnings growth;
- >
- selectively adding to the portfolio through new site development and existing store acquisitions;
- >
- maintaining a conservative capital structure in the business with Group interest cover of a minimum of five times; and
- >
- producing sustainable returns for shareholders through a low leverage, low volatility, high distribution REIT.
In the sixteen years since flotation in May 2000, Big Yellow has delivered a Total Shareholder Return (“TSR”), including dividends reinvested, of 15.9% per annum, in aggregate 938% at the closing price of 774.5p on 31 March 2016. This compares to 6.9% per annum for the FTSE Real Estate Index and 4.3% per annum for the FTSE All Share index over the same period. This demonstrates the power of compounding over the longer term.
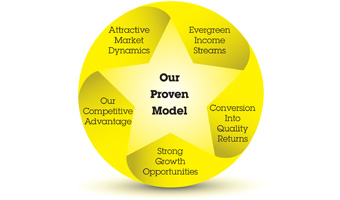
Our business model Tried and tested...
| Attractive market dynamics |
|
|
| Our competitive advantage |
|
|
| Evergreen income streams |
|
|
| Strong growth opportunities |
|
|
| Conversion into |
|
The self storage market
In the recently published 2016 Self Storage Association UK Survey, only 41% of those surveyed had a reasonable or good awareness of self storage, in line with findings from our own research. Furthermore, only 7% of the 2,075 adults surveyed were currently using self storage or were thinking of using self storage in the next year. This indicates a continued opportunity for growth and with increasing use, together with the ongoing marketing efforts of everyone in the industry, we anticipate awareness will grow.
Growth in new facilities across the industry has been largely in regional areas of the UK and in particular in smaller towns. In London in 2015, we believe there were six new store openings last year (including our Enfield store), and three closures of stores for redevelopment into alternative uses. Between 2010 and 2015 average industry openings have been approximately 11 per year, which compares to an average of 34 per year in the preceding four years.
The Self Storage Association (“SSA”) estimates that the UK industry is made up of approximately 1,077 self storage facilities (of which 195 are purely container operations), providing 37.6 million sq ft of self storage space, equating to 0.6 sq ft per person in the UK. This compares to 7.8 sq ft per person in the US, 1.8 sq ft per person in Australia and 0.1 sq ft for mainland Europe, where the roll-out of self storage is a more recent phenomenon (source: Fedessa European Self Storage Annual Survey 2015). 357 self storage facilities in the UK are held by large operators (defined as those managing 10 facilities or more), which represents 40% of the total number of self storage centres, but we would estimate approximately 50% to 60% of total capacity.
Big Yellow is well placed to benefit from the growing self storage market, given the strength of our brand, and online platform which delivers approximately 86% of our prospect enquiries. Our portfolio is strategically focussed on London, the South East and large metropolitan cities, where barriers to entry and economic activity are at their highest.
KPIs
The key performance indicators of our stores are occupancy and rental yield, which together drive the revenue of the business. These are three key measures which are focussed on by the Board, and are reported on a weekly basis. Over the course of past five years, both occupancy and revenue have grown significantly. Rental yield was relatively stable between 2011 and 2012, reduced following the introduction of VAT in 2013, grew by 6.1% in the year to 31 March 2014, and decreased by 3.5% in 2015 principally reflecting the acquisition of the Big Yellow Limited Partnership stores, a regional portfolio, at a lower average net rent per sq ft. In the current year, net rent has increased by 2.7%. Our key focus is on continuing to grow occupancy, with rental yield growth following once the stores have reached higher occupancy levels.
Adjusted profit before tax, adjusted earnings per share and distributions to shareholders are our other KPIs. We have delivered compound eps growth of 14% over the past five years, and compound dividend growth of 26% over the same period. Compound adjusted eps growth since 2004/5 is 17%. We have illustrated the Group’s performance in these measures over the past five years on page 11.
We have the largest online market share of web visits to self storage company websites in the UK.