
Corporate Social Responsibility Report
Corporate Social Responsibility Report
Big Yellow recognises that a high level of Corporate Social Responsibility (“CSR”), linked to clear commercial objectives, will create a more sustainable business and increase shareholder and customer value.
- 1.0
-
INTRODUCTION
Big Yellow recognises that a high level of Corporate Social Responsibility (“CSR”), linked to clear commercial objectives, will create a more sustainable business and increase shareholder and customer value. Our CSR Policy covers all of our operations, as a self storage provider, a property developer, an employer and a participant in our local communities. Big Yellow seeks to meet the demand for self storage from businesses and private individuals by providing the storage space for their commercial and/or domestic needs, whilst aiding local employment creation and contributing to local community regeneration.
- 2.0
-
CSR EXECUTIVE SUMMARY
Big Yellow is pleased to deliver another year of steady Corporate Responsibility progress across the Group, full details of which can be found in this CSR Report. Our focus over the last year has delivered the following benefits:
Support for Local Charities
We have continued to recognise and support 14 different charities selected by both our stores and head office teams. Our people undertook a variety of activities for these (and other) charities and raised £74,000 of funds during the year (up 66% on 2016). At the same time Big Yellow and Armadillo donated the equivalent of over £940,000 of free storage in the last year (up 25% on 2016).
The Big Yellow Foundation
We registered a new charitable Foundation in January 2017. We are currently piloting the use of the Foundation to raise money from both Big Yellow and its customers. Following the conclusion of this pilot, we will launch it to the whole business in autumn 2017. The aim of the Foundation will be to use the funds to support charities working to bring people back into society from disadvantaged backgrounds. We will also aim to provide them with employment opportunities at Big Yellow and Armadillo.
Health & Safety Record
This has continued at a high standard at both our stores and on our construction projects. Measured by both the number of recorded Minor Injuries and by RIDDOR (Reporting of Injuries, Diseases and Dangerous Occurrences Regulation), our high standards of Health & Safety have protected our customers, staff, contractors and other visitors.
LED Lighting Investment
We have continued to invest in providing LED lighting both inside our stores, and more recently for all of our external lighting. During the next 12 months we will continue to deliver the benefit of LED lighting to all of our external lighting sources – and to both Big Yellow & Armadillo stores that still require internal lighting improvement after recent acquisition.
Greenhouse Gas (‘GHG’) Emission
Our store electricity use in absolute terms is now 31.3% lower than our peak use year of 2011. Our ability to continue to reduce our absolute electrical use will diminish, as we complete our LED investment program and as we open and acquire new stores. However, our relative GHG Emission (per sq metre occupied) is down 63.8% from our peak year of 2011 and we aim to continue with this relative reduction.
CSR Performance Benchmarking
42% of our stores have EPCs (Energy Performance Certificates) the majority of which are rated A or B. We will also continue to participate in our sustainable benchmarking initiatives with EPRA, FTSE4Good, the Carbon Disclosure Project (“CDP”) and the Global Real Estate Sustainability Benchmark (“GRESB”).

- We recognise the importance of supporting local community projects and charities through fundraising and donating free storage space.
- During the year we donated space in our stores worth approximately £940,000 to charities.
2.1 OUR PEOPLE
Our people are at the heart of Big Yellow’s business, bringing our values to life through the service that they provide and through the energy and passion that drives us to become an ever more responsible and sustainable business.
We recognise that recruiting, retaining and motivating individuals with talent and integrity, and ensuring that we listen to our people and maximise their skills and performance, is key to the continued success of our Company.
We encourage a culture of partnership within the business and believe in staff participating in corporate performance through benefits such as customer feedback rewards, bonus schemes and share incentives. We recognise and reward the exceptional performance, achievements and ideas of our people through a Points Recognition Scheme, and allocated £53,000 of points for the year ended 31 March 2017.
Wellbeing and Support
We aim to promote employee wellbeing through a range of flexible working options, which include flexitime, staggered working hours, home working and sabbaticals. We provide Childcare Vouchers along with a comprehensive range of medical support and advice through our private healthcare scheme and occupational health providers. We have arranged corporate gym membership on a national basis, as well as a “Cycle to Work” scheme and Employee Assistance Programmes.
Communication and Engagement
We continue to recognise the importance of communication and consultation with an annual Spring Conference, regular formal and informal meetings, quarterly newsletters and weekly operational updates. In addition, the Directors and Senior Management spend a significant amount of time in the stores and are always accessible to employees, at all levels.
In May 2016, we ran our second externally managed Employee Engagement Survey which was structured to look at key areas including our day to day working life, learning and development, team work, communication, management style and leadership. The survey achieved a response rate of 90% (also 90% in 2014) and an Engagement Indicator of 90% (86% in 2014). Management are now using the feedback from the Engagement Survey as the focus of their attention to further improve the working environment.
Training and Development
We continue to promote the development of our staff through ongoing training and regular performance appraisals. For the year ended 31 March 2017 a total of 1,267 days training were provided across the Company, comprising of both sales and operational training, and personal and management development.
We have continued to develop our internal training resources to include e-learning on security, a Health & Safety library, 17 operational and sales based workshops and 10 centrally run courses covering induction, management training and personal development.
During the year, six team members completed our personal development programme designed specifically for Assistant Store Managers, with three of those people having subsequently been promoted to the position of Store Manager. 13 Assistant Store Managers are currently participating in the new programme, to prepare them for their future progression within the Company as opportunities arise.
During the year a new development programme for our Sales Advisors was also introduced, the aim of which is to prepare them for promotion to the position of Assistant Manager. The programme will run on an annual basis with 14 Sales Advisors currently participating.
As a result of our other internal training and development programmes, 53% of our store based staff have been promoted to their current position from a more junior position.
Community
We continue to recognise the importance of contributing to the local community and we encourage our people to develop close links with charities, schools and other institutions, both locally and nationally, to help to build more economically sustainable environments.
For the year ended 31 March 2017, we recognised and supported 14 different charities which were selected by our store and head office teams. Our people undertook a variety of activities for both these – and other charities – with donations also being made by the Company.
Throughout the year a total of £74,000 was raised for our recognised charities and examples of our fundraising activities and charitable giving have included:
The Phyllis Tuckwell Hospice, Surrey
Team members have participated in various charity runs and other events to raise a total of £4,000 across the year for this Surrey-based hospice.
“Phyllis Tuckwell Hospice Care is delighted to have worked with Big Yellow Self Storage over the last year and would like to thank the Directors and staff for their fundraising. Their events have been creative and good fun, from sweepstakes, raffles and walks to a Halloween chilli lunch. They have also supported us through sponsorship, taking the yellow colour stand at our annual Dash of Colour Run. Without the help of corporate partners like Big Yellow we simply couldn’t provide the compassionate end of life care that we do.”
Vanessa Beech, Corporate Partnerships Fundraiser, Phyllis Tuckwell Hospice Care
British Heart Foundation
Nine of our stores have acted as “Donation Stations” for the British Heart Foundation, raising a total of just under £20,000 for the year from collecting bags of unwanted clothes and household goods. The funds raised will support the charity’s pioneering heart research, as well as the care of people living with heart disease.
Dorothy Stringer School, Brighton
Big Yellow has donated £8,500 as lead sponsor of this Brighton-based school’s planned football tour of South Africa during 2017. 20 students will be given the opportunity to participate in the tour, during which they will take part in scheduled games, as well as visiting various schools and township charities to enable them to fully appreciate the culture of the country.
“Two years ago we set out to create a once-in-a-lifetime experience for the current Year 10 football team; a tour to South Africa. It soon became clear that the trip was going to cost around £50,000 and it was great to receive a donation of £8,500 towards the cost from Big Yellow. This will enable us to offer the students an eye opening experience, as well as kitting them out in tour attire. We are very grateful to Big Yellow Self Storage for their support in helping to make this life changing event happen.”
Charlotte Young, Teacher of Physical Education, Dorothy Stringer School
Go Dad Run
Big Yellow has provided sponsorship of £20,000 for the Go Dad Run in June 2016, the aim of which is to raise awareness of, and funds for, Prostate Cancer UK through a series of 5k and 10k runs in different cities around the UK.
“For a small but growing project like Go Dad Run, the relationship with our sponsors is absolutely crucial and in 2016 we were, once again, enormously grateful for the wonderful support from Big Yellow Storage. It was the third year of our partnership and we staged 5K and 10K runs in Sunderland, London, Worcester, Cardiff, Bristol and the Isle of Man, where many hundreds of men and boys pulled their giant Go Dad Run Y-fronts on over their shorts, to take part and raise funds for Prostate Cancer UK - and to raise awareness of important men's health issues. Our friends and colleagues at Big Yellow Self Storage were essential to helping us to make that happen”.
Colin Jackson, CBE, Founder of Go Dad Run
Southwark Tigers Rugby Club, London
During the last year, Big Yellow has provided sponsorship of £2,500 to this inner city junior rugby club, whose aim is to benefit young people through the skills learnt in the game of rugby and to make it affordable and attractive to them all.
Caius House, Battersea, London
Caius House is a charity and a youth club based in Battersea, which aims to provide young people within the local community with a safe place to go to where their skills and talents can be progressed to fulfil their potential. During the last year, Big Yellow has provided the Caius House football team with sponsorship of £10,000.
Free Storage Space
In addition to our fundraising activities, we have also provided charities with free storage space. For the year ended 31 March 2017, the space occupied by charities in Big Yellow and Armadillo stores was 45,500 sq ft, worth approximately £940,000 per annum at current rents. Some of the many charities that have benefited from this storage include Cancer Research, Macmillan Cancer Support, the National Childbirth Trust, the British Heart Foundation and a number of food bank and children’s charities local to our stores.
The Big Yellow Foundation
Big Yellow registered “The Big Yellow Foundation” in January 2017. This Foundation will help highly innovative charities transform the lives of vulnerable people across the UK. Big Yellow will donate £1 every time a customer moves into one of our stores. We will also ask customers if they would like to join us in supporting our mission at either the point of move in or move out.
The Foundation, which will be launched formally in autumn 2017, will focus its support on charities that have developed effective approaches to help the reintegration, training and employment of ex-offenders and of those fleeing persecution, who have been granted asylum by the UK Government. Together we believe we can help vulnerable people across the UK to build brighter lives. Three initial charities that we are working with currently, as part of a soft launch, are Bounce Back, Breaking Barriers and the St Giles Trust.
2.2 OUR HEALTH & SAFETY
Big Yellow recognises the importance of maintaining high standards of Health & Safety for our customers, staff, contractors and any visitors to our stores. The Group’s Health & Safety Committee reviews its Policy, Risk Assessments, performance and records on a quarterly basis. The Policy covers two distinct areas – our construction activities and our routine store operations.
The Health & Safety Committee discuss and review any issues reported from our regular meetings held at our head office, Maidenhead (our distribution warehouse), the stores and our construction sites. Our Health & Safety Policy states that all employees have a responsibility for Health & Safety, but that managers have special responsibilities. The responsibilities of Adrian Lee, Operations Director, are to keep the Board advised on Health & Safety issues and to ensure compliance with the Policy in respect of Construction (via the Construction Director) and store operations (via the Facilities Manager and Head of Store Operations).
The Health & Safety Committee minutes are copied to the CEO, the CSR Manager, the Head of Human Resources, the Facilities Manager and our external Health & Safety consultant. Externally, other interested stakeholders include the Health & Safety Executive (HSE) and Local Government Authorities.
Our external Health & Safety consultant reviews our Policy and performs audits of our stores on a rolling programme, to ensure the implementation of the Group’s Health & Safety policies and to ensure compliance with the latest Health & Safety standards. Actions recommended by our consultant are reviewed by the Health & Safety Committee, and if required are then implemented into the operations or construction systems. External Health & Safety audits are carried out by our consultants on a regular basis on each construction site during the construction process.
Our Health & Safety reporting covers all of our stores, our head office, Maidenhead (our distribution warehouse) and our construction sites. Incidents are recorded for staff, customers, contractors and visitors. The Board receives reports that monitor Health & Safety performance in all these areas. Annual Store Health & Safety Meetings take place for all stores and Maidenhead. Meeting agendas are provided for all meetings by the Facilities Team and the minutes are reviewed by Area Managers to raise any issues with our Facilities or Human Resources Teams, where necessary.
Health & Safety performance and incidents are reported and are displayed in the tables below:
2.2.1 Big Yellow Store Customer, Contractor and Visitor Health and Safety
Store Customer, Contractor and Visitor Health & Safety
Year ended 31 March2013 2014 2015 2016 2017 Number of customer move-ins 65,807 72,772 75,097 75,438 71,715 Number of minor injuries 34 31 50 58 41+ Number of reportable injuries (RIDDOR)* 3 3 4 4 1+ RIDDOR* per 100,000 staff 4.6 4.1 5.3 5.3 0 - +
- Indicates data reviewed by Deloitte LLP as part of their assurance work. See page 58 for the independent assurance report.
- *
- RIDDOR – Reporting of Injuries, Diseases and Dangerous Occurrences.
The number of customer ‘move-ins’ during the last year reduced from 75,438 to 71,715 (a 5.0% reduction) and this has in part contributed to the reporting of fewer minor injuries from 58 to 41 (down 29%) in 2017. One ‘reportable injury’ to a customer at Finchley North was recorded during the year. Customer minor injuries were mainly cuts, grazes and strains relating to the handling of their goods. Most of these injuries and those of ‘visitors’ could have been avoided by personal protective gloves and foot-wear. Visitor injuries were due to cuts from their containers, vehicles or business equipment.
2.2.2 Big Yellow Staff Health & Safety (Stores & Head Office)
Year ended 31 March 2013 2014 2015 2016 2017 Average number of staff 286 289 300 318 329+ Number of Minor Injuries 15 13 15 10 9+ Number of Reportable Injuries (“RIDDOR”) 3 1 1 1 0+ AIIR* per 100,000 staff 1,049 346 333 314 0+ - +
- Indicates data reviewed by Deloitte LLP. See page 58 for their independent assurance report.
- *
- Annual Injury Incident Rate is the number of staff reportable injuries / average number of staff (x100,000).
Nine staff injuries reported as minor injuries were related to hand or arm injuries. There were no “Fatal Injuries, Notices or Prosecutions” during the year ended 31 March 2017. This year our staff training schedules enabled us to provide customers with Fire Health & Safety Risk Assessments, where necessary, which raised their awareness of the potential for personal injuries while they used self storage.
Two new stores, at Nine Elms and Twickenham 2, were acquired in the year and our Cambridge store was open for the full financial year. These changes have increased our average number of staff employed to 329 for the year. Against this increase we have achieved a reduction in Minor Injuries from 2016. Minor Injuries were mainly cuts, grazes and bruises relating to safety when using stairwells, doors and pallets. There were no “reportable injuries” for staff in the year, so the Annual Injury Incidence Rate (AIIR) decreased to zero against an average store staff increase of 3.5%. There were no “Fatal Injuries, Notices or Prosecutions” during the year ended 31 March 2017.
Total minor injuries for staff, customers, contractors and visitors was 50 and were recorded as follows: 34 to customers, nine to staff, six to visitors and one to a contractor.
2.2.3 Big Yellow Construction ‘Fit Out’ Health & Safety
Construction Fit-out Contractors and Visitor Health & Safety
Year ended 31 March2013 2014 2015 2016 2017 Number of Total Man Days 610 3,315 3,005 6,560 1,111 Number of Minor Injuries 0 2 1 3 0 Number of Reportable Injuries (RIDDOR) 0 0 0 0 0 There were no ‘Man Days’ worked on construction ‘Fit Out’ projects for new stores in 2017. However, our storage partitioning contractors recorded 1,111 man days of work for fitting out storage partitioning in our existing stores. No Minor Injuries or Reportable Injuries were recorded during these works.
Our ground works contractor at the new Guildford Central store was in the ‘early piling phase’ and was assessed by the independent Considerate Constructors Scheme (“CCS”) in February 2017. This scheme monitors and reports on the Health & Safety management and environmental aspects of our construction projects. High scores of 7/10 were achieved for ‘Securing everyone’s Safety’ and ‘Care about Appearance’. Good scores of 6/10 were achieved for ‘Respecting the Community’, ‘Valuing the Workforce’ and ‘Protecting the Environment’. There were no ‘Fatal Injuries, Notices, or Prosecutions’ during the year ended 31 March 2017.
- 3.0
-
ENVIRONMENTAL RESPONSIBILITY
Our CSR Policy sets out how we manage the impact of our business on society and the local environment, to control our risks and manage our opportunities in a sustainable manner. We participated in the FTSE4Good Annual Index Series survey and achieved a “low environmental impact”. We also use the detail in this CSR Report to participate in other benchmarks, such as the annual Carbon Disclosure Project (“CDP”) and Global Real Estate Sustainability Benchmark (“GRESB”) to engage with our other Ethical Investors. Notwithstanding this and in order to maintain an efficient and sustainable business for our stakeholders, we have continued to commit significant resources to the environmental and social aspects of our storage operations, property portfolio, new store developments and site acquisitions.
In this report we state our energy use and carbon emissions in compliance with the Companies Act and the Climate Change Regulation on Reporting Greenhouse Gas (“GHG”) Emissions for listed companies. For more details on our applications for the above benchmarks please go to the ‘Basis of Reporting’ section of the CSR section of our Investor Relations website.
In this report we have provided a summary of our Scope 1 ‘onsite’ gas use, solar electricity generation and refrigerant use, and Scope 2 ‘off site’ supplied electricity for our carbon dioxide equivalent (CO2e) emissions. We have used the DEFRA Department Environmental Reporting Guidelines 2013 Version 1.0 (Standard Set 2016; expiring 30 June 2017) conversion factors for our annual GHG Emission calculations and reporting. Also we are reporting using the UK Government GHG conversion factors for company reporting (expiring 30 June 2017).
Finally, we also report on our environmental key performance indicators and identify them using the codes from the Global Reporting Initiative (“GRI”), as applied by the European Public Real Estate Association (“EPRA”) at the request of some of our stakeholders. Annual ‘same store’ portfolio electricity use and carbon emission comparisons are shown. Our materiality threshold for energy use is 5% and for carbon emissions is >1%. A limited level of assurance for our Scope 1 and 2 energy use and GHG emissions is independently applied. This assurance is undertaken by Deloitte LLP in accordance with the International Standard on Assurance Engagements (ISAE) 3000 (Revised).
Long Term Electricity Use – 2008 to 2017
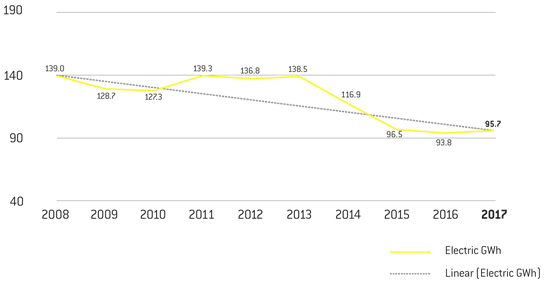
Between 2008 and 2010 we installed motion sensor lighting in many of our stores and renewable energy initiatives were included in our new store openings, such as solar panels (on 10 stores); wind turbines (on two stores); and ground source heat pumps (in five stores) and these achieved both electricity use reduction and sustainable electricity generation across our store portfolio.
From 2010 to 2013 there was an increase in our total electricity use as a result of our new store openings and increases in our customer occupancy. Customers increase electricity use by more regular activation of our motion sensor lighting and the increased use of electrical socket supply in our stores. 2011 was our peak year (benchmarking year) for electricity use.
From 2013, our investment in energy efficiency programmes such as internal and external LED re-lamping across the store portfolio and the installation of larger capacity (50kWp) solar panels (at seven of our stores) reduced our electricity use and increased our own electricity generation to 2016.

In the last 12 months our customer occupancy has continued to grow and some stores have required further internal partitioning works (the fit out of second phases of storage space) which has increased our electricity use. In addition store acquisitions at Nine Elms and Twickenham 2 have further added to our total electricity use. Electricity use has therefore increased our linear trend and total use in 2017 was 9,568,862 kWh / year. The acquired stores will be re-lamped with energy efficient LED lamps in the future years.
Electricity Use from Peak Energy Year 2011 (GRI Elec-Abs / G4-ENS3)
Year ended 31 March2013 2014 2015 2016 2017 Electricity Use (kWh)+ 13,153,960 11,688,629 9,643,341 9,376,085 9,568,862 Reductions from 2011 Peak (%) (5.5%) (16.1%) (30.7%) (32.7%) (31.3%) - +
- Indicates data reviewed by Deloitte LLP. See page 58 for their independent assurance report.
Note: 2011 was our peak electricity use (13,925,217 kWh).
From 2017, we no longer including Bagshot and Maidenhead in the Group energy totals, and the consumption at these stores is now reported in a separate table. This approach is explained in the Basis of Reporting.
New Store Acquisitions and ‘Same Store Portfolio’ Electricity Use (2016 v 2017)
Two newly acquired stores in 2017 increased our total electricity use by 99,673 kWh. On an annual ‘same store’ basis, the 2017 total electricity use would have been 9,469,189+ kWh, without the acquisitions, 32.0% below our peak.
Store Portfolio Electricity Use and Climate Change Levy (“CCL”)
Scope 2 Electricity Use and Climate Change Levy Year ended 31 March 2013 2014 2015 2016 2017 % change
from peakElectricity Use (kWh)+ 13,153,960 11,688,629 9,643,341 9,376,085 9,568,862 (31.3%) CCL (£/kWh) 0.00509 0.00524 0.00541 0.00554 0.00559 30.0 % CCL (£) £66,954 £61,248 £52,171 £51,944 £53,490 (10.7%) - +
- Indicates data reviewed by Deloitte LLP. See page 58 for independent assurance report.
Note: 2011 is our peak electricity use (13,925,217 kWh). 2011 Grid electricity cost (excluding VAT) but including CCL (at 0.0043 £ / kWh) was £59,878.
From 2017, we no longer including Bagshot and Maidenhead in the Group energy totals, and the consumption at these stores is now reported in a separate table. This approach is explained in the Basis of Reporting.
Our UK network electricity supply provides 94% of our total energy use. We continue to seek reductions in our kWh use, costs and taxes through investment in our energy efficient technology and from our solar electricity ‘self supply’. Our electricity use has reduced 31.3% since our peak use year in 2011, notwithstanding which the Climate Change Levy has increased by 30%. The CCL for 2017 (£53,490) has been reduced by 20.1% from its peak in 2013, due to our investment in our energy efficient internal and external LED re-lamping programmes. In 2017 there has been an increase of 3% in the CCL due to an increase in the CCL rate and more electricity use, as a result of growing customer numbers and the acquisition of the two additional stores.
Store Portfolio Long Term Solar Electricity Generation (2009 to 2017) (MWh)
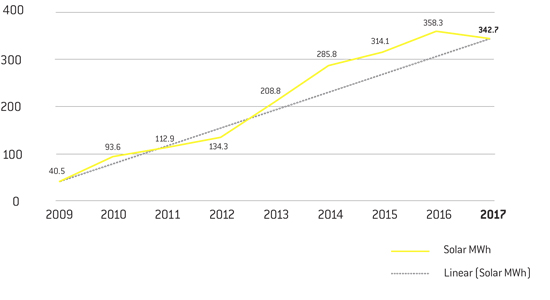
Our portfolio of stores with roof-mounted solar PV installations generate low carbon electricity that is monitored for performance and receives financial payments from the energy companies that we export to. There are 17 stores with PV installations and the ‘Feed-in Tariff’ payments for generation and ‘Deemed Export’ of electricity apply to all these installations.
Solar generation performance in the first quarter of 2017 reduced due to our PV systems at Fulham and Merton requiring inverter replacement and maintenance, respectively. In June 2016, solar generation also under-performed due to unseasonal cloud cover. In the second and third quarters of 2017 our Sheen and Bromley solar installations lost generation data communication; these were repaired during annual maintenance visits and payments then continued to be received.
Renewable Energy Generation, Savings and Materiality
Onsite Solar ‘Self Supply’ Generation
Year ended 31 March2013 2014 2015 2016 2017 Solar Generation (kWh) 208,807 285,832 314,068 358,279 342,670 + Total Grid Use (kWh) 13,153,960 11,688,629 9,643,341 9,376,085 9,568,862 Total Grid Savings (£)* 74,724 100,468 106,607 115,216 113,652 Solar % of Grid Use (kWh) 1.6% 2.4% 3.3% 3.8% 3.6% - +
- Indicates data reviewed by Deloitte LLP. See page 58 for their independent assurance report.
- *
- Solar Payments from Energy Companies are Feed in Tariff plus Deemed Export kWh payments amounting to £82,812;
Supplied UK Network displaced electricity savings; 342,670 solar kWh x 9p Grid kWh displaced amounting to £30,840.
Note: 2011 is our first significant (107,074 kWh/y) solar electricity ‘Self Supply’ generation.
In total our solar portfolio generated 342,670 kWh in 2017, a reduction of 4.4% compared to the previous year. This was mainly due to maintenance issues and less sunshine hours in June 2016. Solar electricity generation represents a saving of approximately 9 pence per kWh for displaced UK network supplied electricity, a saving of £30,840 over the year. The total payments from EDF and Good Energy for solar generation ‘Feed in Tariff’ and ‘Deemed Export’ payments was £82,812, providing us with a total saving of £113,652 for 2017.
Solar electricity contributed 3.6% of our total supplied store electricity use or 14.2% of the electricity use in the 17 stores with solar PV systems. Our larger capacity 50 kWh installations (such as the system at Gypsy Corner) generate approximately 40,000 kWh/year. This can equate to nearly 30% of the stores annual kWh demand. During the first three years of a stores trading (from new build) we can export more electricity (up to 60% of the electricity generated) back to the Grid. In later years, when customer occupancy rises to store ‘maturity’ (85% occupancy) more solar electricity is used by the store and export to the national network diminishes.
Customer Gas Use in Stores for Flexi Office Heating
GRI Absolute Gas Use Reductions (‘Fuels-Abs’ F4-EN3)
Year ended 31 March2013 2014 2015 2016 2017 Gas Use (kWh) 716,508 652,181 602,563 592,257 630,463+ Gas Use Reductions from 2012 Peak Use (%)
(3.4%)
(12.1%)
(18.8%)
(20.2%)
(15.0%)- +
- Indicates data reviewed by Deloitte LLP. See page 58 for their independent assurance report.
Note: 2012 is our peak gas use benchmark (742,086 kWh).
Gas use for the heating of our flexi offices at eight stores reached a peak benchmark in December 2012, due to the coldest winter since our records began. The increase in gas use in 2017 was 6.5% and is predominantly due to higher flexi office occupancy compared to the previous two years.
Total Energy Use (Electricity and Gas) and Materiality
Total Electricity and Gas (kWh) Use and Gas Use Materiality (%)
Year ended 31 March2013 2014 2015 2016 2017 Total Energy Use (kWh) 13,870,468 12,340,810 10,245,904 9,968,342 10,199,325 Total Reductions from 2011 Peak (%)
(4.9%)
(15.4%)
(29.7%)
(31.6%)
(30.1%)Gas Materiality % 5.2% 5.3% 5.8% 5.9% 6.2% Note: 2011 was our peak energy use year (14,581,234 kWh)
In 2017, our combined UK network supplied energy (electricity and gas) reduced by 30.0% from our peak energy use in 2011, mainly due to electricity efficiency reductions after our LED re-lamping programmes and reduced gas use due to new boiler efficiency and less demand in the warmer winters since 2012. In 2017 there was a 2.3% increase in energy use due to higher levels of customer occupancy in our stores and the acquisition of two new stores.
Our gas use ‘materiality’ compared to total gas and electricity use increased to 6.2% in 2017, 1.2% above the materiality threshold level of 5% for reporting gas data.
UK Network Supplied Energy Intensity (Electricity and Gas)
Energy Intensity per Annual Average Occupancy and per Gross Internal Floor Area (Energy-INT/CRE1)
Year ended 31 March2013 2014 2015 2016 2017 % change
from 2011 peakTotal Energy Use (kWh) 13,870,468 12,340,810 10,245,904 9,968,342 10,199,325 (30.1%) Annual Average Occupancy (m2) 244,521 263,101 283,732 304,964 325,537 64.5% kWh/Annual Average Occupancy 56.7 46.9 36.1 32.7 31.3 (57.5%) Gross Internal Floor Area (m2) 582,872 582,872 605,419 621,050 629,686 15.4% KWh / GIFA (m2) 23.8 21.2 16.9 16.1 16.2 (39.3%) - +
- Indicates data reviewed by Deloitte LLP. See page 58 for their independent assurance report.
Note: 2011 is our Peak Energy Use of 14,581,234 kWh; Annual Average Occupancy was 197,884 m2;
Intensity was 73.7 kWh / occupancy m2; Intensity was 26.7 kWh / m2 of GIFA .
Since 2011 customer occupancy has increased by 64.5% and energy use intensity (per annual average occupancy) has reduced by 57.5%. Our total store portfolio gross internal floor area (‘GIFA’) increased between 2011 and 2017 by 15.4% through new store openings and store acquisitions. This has helped us to achieve a 39.3% reduction in kWh use per GIFA from 2011.
Energy (Electricity and Gas) Use / Revenue Intensity (Energy-INT/CRE1) Year ended 31 March 2013 2014 2015 2016 2017 % change
from 2011 peakTotal Energy Use (kWh) 13,870,468 12,340,810 10,245,904 9,968,342 10,199,325 (30.1%) Revenue (£000) 69,671 72,196 84,276 101,382 109,070 76.3% kWh / £ Revenue 0.20 0.17 0.12 0.10 0.09 (62.5%) - +
- Indicates data reviewed by Deloitte LLP. See page 58 for their independent assurance report.
Note: 2011 is our Peak Energy Use 14,581,234 kWh; Revenue was £61,885,000; kWh / £ Revenue was 0.24;
Group revenue has increased by 76.3% since 2012. Our energy use intensity (kWh per revenue) has reduced by 62.5% in the same time period. Revenue intensity reduction represents all of the self storage activities and services from our 73 store portfolio. A reduction of 10% in our energy use by revenue intensity was achieved in 2017, maintaining our annual reductions in intensity since 2011.
‘Non-Store’ Portfolio (Head Office and Maidenhead) Energy Use (Electricity) kWh
Head Office and Maidenhead Electricity Use
Year ended 31 March2012 2013 2014 2015 2016 2017 Head Office (kWh) 115,515 110,829 104,366 98,585 89,078 89,448 Maidenhead (kWh) 15,934 16,133 17,813 16,927 19,182 18,747 Total (kWh) 131,449 126,962 122,179 115,511 108,260 108,195 Reductions* (11.2%) (14.2%) (17.4%) (22.0%) (26.9%) (14.2%) Annual Reductions (11.2%) (3.4%) (3.8%) (5.5%) (6.3%) (0.1%) - *
- Reductions from Peak year 2011: Head Office GIFA was 524 m2; Energy use was 126,050 kWh;
Note: Maidenhead GIFA was 889 m2; Energy use was 21,942 kWh; 2011 Total Portfolio GIFA 1,413 m2; Total energy use was 147,992 kWh.
Our non-store portfolio consists of two business administration centres; our head office at Bagshot, Surrey and our warehouse depot for the storage and distribution of our packing materials at Maidenhead, Berkshire. They both provide services to the store portfolio. The head office electricity use is more intense due to higher staff occupancy. Electricity is mainly used for lighting, heating or cooling and computer equipment in the office areas. The total electricity reductions for both the head office and Maidenhead from the benchmark year 2011 was 14.2%. The reductions were mainly due to energy efficient LED re-lamping and more efficient air conditioning and IT equipment investment programmes.
Mandatory Greenhouse Gas (GHG) Emissions Statement
The ISAE 3000 Standard provides an evaluation methodology for both the quantitative and qualitative aspects of our carbon management and our energy use. We report our ‘self storage’ portfolio emissions and the ‘absolute’ emissions that include our ‘non store portfolio’.
Our key carbon emission performance indicators use the GRI and the EPRA codes, at the request of our investors and other stakeholders, for real estate investment trust (REIT) benchmarking purposes.
We report energy use and carbon emissions in compliance with the Companies Act and Climate Change Regulation on Reporting Greenhouse Gas (“GHG”) Emissions for listed companies. For more details on our applications for the above benchmarks see the ‘Basis of Reporting’ section of the CSR section of our Investor Relations website.
In this Report we have provided a summary of our Scope 1 ‘onsite’ heating gas use, solar electricity generation and refrigerant use, and Scope 2 ‘off site’ UK supplied electricity, for GHG equivalent (CO2e) emissions. We have used the DEFRA DECC Version 1.0 (Standard Set 2016; expiry on 30 June 2017) conversion factors for our annual emission calculations and reporting.
UK Government GHG Emission Conversion Factors For Company Reporting
Standard Set From 30/06/2016 To 30/06/2017Scope Fuels Unit Conversion Factors 1 Natural Gas (Gross CV) kWh 0.18400 1 R410A Refrigerant* KgCO2e 2,088 2 Electricity Grid Supply kWh 0.41205 3 Electricity Transmission & Distribution kWh losses 0.03727 3 Commercial Refuse / Waste Disposal kgCO2e 199.0 - *
- Kyoto Protocol air conditioning Refrigerant ‘top up’ / ‘global warming fugitive emissions’.
Annual ‘same store’ portfolio electricity use and carbon emission comparisons are used. Our materiality threshold for energy use is 5% and for carbon emissions is > 1 %. A limited level of assurance for our Scope 1 and 2 energy use and GHG emissions is independently applied. This assurance is undertaken by Deloitte LLP in accordance with the International Standard on Assurance Engagements (ISAE) 3000 (Revised).
Scope 1 Real Estate Portfolio – Direct GHG Emissions
Eight of our stores provide flexi office services with gas heating for customers.
Scope 1 Flexi Office Stores Gas Heating Emissions (GHG-Dir-Abs) Year ended 31 March 2013 2014 2015 2016 2017 % change
from 2012 peakGas Use (kWh) 716,508 652,181 602,563 592,257 630,463 (15.0%) GHG Emission (tCO2e) 133.0 120.0 111.5 109.2 116.0+ (15.8%) - +
- Indicates data reviewed by Deloitte LLP. See page 58 for their independent assurance report.
Note: 2012 is our peak benchmark year for gas use (742,086 kWh) and emissions (137.8 tCO2e).
The financial year 2017 heating gas conversion factor was kWh x 0.18400 (kgCO2e).
From 2012 milder winters have reduced gas use and GHG emissions by 15.8%. In 2017 our GHG emissions have increased by 6.2% due to increased customer occupancy of our flexi-offices with gas heating.
Scope 1 Refrigerant (R410A) Replacement and GHG Emissions Year ended 31 March 2013 2014 2015 2016 2017 % change
from 2014 peakRefrigerant Use (Kg) 66.5 112.4 11.9 11.3 32.5* (71.1%) Emissions (tCO2e) 286.3 354.8 20.6 21.9 67.9+ (80.9%) - +
- Indicates data reviewed by Deloitte LLP. See page 58 for their independent assurance report.
- *
- The Scope 1 Refrigerant R410A, 2017 Kg:tCO2e conversion factor was 2,088;
Note: 2014 was our peak year for refrigerant replacement and related GHG emissions.
This year seven stores had refrigerant ‘top up’ totalling 32.5 kg. Refrigerant use has reduced from our peak use in 2014 by 71.1% and tCO2e emissions have reduced by 80.9%. Scope 1 Refrigerant emissions from our store portfolio air conditioners occur when small quantities of Refrigerant require ‘topping up’. The Refrigerant we use (R410A) is a ‘Kyoto Protocol Blend’ that maintains an efficient working environment. Refrigerant use has a direct global warming impact and is required to be recorded for local and national reporting purposes over a 100 year period, by the Intergovernmental Panel on Climate Change.
Scope 1 Total Direct Gas and Refrigerant GHG Emissions
Year ended 31 March2013 2014 2015 2016 2017 % change
from 2014 peakScope 1 Gas (tCO2e) 133.0 120.0 111.5 109.2 116.0+ (3.3%) Scope 1 Refrigerant (tCO2e) 286.3 354.8 20.6 13.5 67.9+ (81.0%) Total Scope 1 (tCO2e) 419.3 474.8 132.1 122.7 183.9+ (61.3%) - +
- Indicates data reviewed by Deloitte LLP. See page 58 for their independent assurance report.
Note: 2014 was the peak year for Total Scope 1 ‘Direct’ GHG emissions.The 2017 total Scope 1 ‘Direct’ GHG emissions from gas and coolant emissions is 183.9 tCO2e. This represents a significant 61.3% reduction in GHG emissions from our peak emissions year in 2014 and was partly due to our choice of Refrigerant, which is now an efficient Kyoto Protocol Blend.
Scope 2 National Network Supplied Electricity and GHG Emission
Scope 2 Electricity GHG Emission
Year ended 31 March2013 2014 2015 2016 2017 % change
from 2011 peakElectricity (kWh) 13,153,960 11,688,629 9,643,341 9,376,085 9,568,862+ (31.3%) Scope 2 (tCO2e) 6,470 5,682 5,908 4,456 3,943 (41.7%) - +
- Indicates data reviewed by Deloitte LLP. See page 58 for their independent assurance report.
Note: 2011 was the peak electricity use (13,925,217 kWh and 6,758 tCO2e).
Our Scope 2 UK Network Supplied Electricity use has reduced by 31.3% from our peak in 2011 due to our energy efficiency programmes; these have reduced GHG emissions by 41.7% over the same time period. Our Scope 2 supplied electricity has had a variable fuel mix over the last decade. In recent years we have estimated that low carbon renewables and nuclear generated supplied electricity have contributed to reducing our GHG emissions by around 1% per year over the last 5 years, based on DEFRA DECC UK Scope 2 electricity conversion factors.
GHG Emission Reductions
Since 2011 our carbon reduction programme has focused on the most significant Scope 2 Grid supplied electricity use and we have achieved reductions based on investment in efficient lighting and maintaining our renewable electricity generation. We continue to monitor future improvements in replacement LED lamp efficiency to meet the long-term ‘climate change science-based targets’.
Our electricity supply from power stations provided 95% of our total annual energy in the year ended 31 March 2017.
Our annual average carbon emission reductions from 2011 is approximately 7% per annum; more than double the target set for the commercial property sector to meet the UK Government’s GHG emission target of a 34% reduction by 2020 (or a 3.5% reduction per annum to 2050). Apart from these savings, our electricity efficiency investment programmes have achieved proportional cost savings on our CCL bills and our annual CRC Taxes.
Store Portfolio ‘Like-for-Like’ Electricity and tCO2e Reductions
GRI and EPRA ‘Like-for-Like’ Standards (G4-EN3 / Elec-LFL)
Year ended 31 MarchPortfolio 2016 Portfolio 2017 % change Total Electricity Use (kWh) 9,376,085+ 9,568,862 2.1% 2016 Acquired Store Use (kWh) (108,260) (99,673)** – LFL Electric Use (kWh) 9,267,825 9,469,189 2.2% LFL tCO2e 4,581 3,903+ (14.8%) - *
- Excluding non-store portfolio electricity use (Head Office and Maidenhead) 2016.
- **
- Excluding our acquisitions at Nine Elms and Twickenham 2 kWh use in financial year 2017.
kWh conversion factor in 2016 is 0.49426; and conversion factor in 2017 is 0.41205
The ‘Like-for-Like’ store portfolio over the last two financial years, excluding our two administrative buildings and the two store acquisitions, indicate that electricity use in 2017 increased by 2.2% compared to the previous year. However, the ‘Like-for-Like’ stores have delivered GHG emission reductions of 14.8% in 2017.
Climate Change Act 2008 - ‘Carbon Reduction Commitment’ (“CRC”) Tax
The Department of Energy and Climate Change (“DECC”) and the Environment Agency (“EA”) are stakeholders in the policy for reducing carbon dioxide emissions from large private sector organisations.
CRC Carbon and Tax Reductions (2013 to 2017)
Year ended 31 March2013 2014 2015 2016 2017* Total tCO2 Emissions* 7,598 6,415 5,408 4,926 – Reduction in tCO2 (%) from 2011 Peak (0.1%) (15.7%) (28.9%) (35.3%) – Tax Rates (£/tCO2) £12.00 £12.00 £16.40 £16.90 £17.20 Tax Payments (£) £91,176 £76,980 £88,691 £83,249 – Tax Reductions from 2011 Peak (%)* (0.1%) (15.7%) (2.9%) (8.8%) – - *
- Annual CRC Tax reporting occurs after the CSR Report publication and we provide the numbers later in 2017.
Note: 2011 was the peak CRC Tax Payment of £91,296 (7,608 tCO2) at £12.00/tCO2.
tCO2 emissions from Grid supplied electricity, gas and self-supplied solar panel electricity.The CRC Tax Rate on carbon emissions from our use of network electricity and gas and from self supplied solar electricity rose from £16.90 per tonne in 2016, to £17.20 per tonne in 2017. Under the CRC Tax scheme our total tCO2 emissions reduced by 35.3% in 2016 (from our peak emissions in 2011). Our CRC Tax reduction from 2011 to 2016 was 8.8%.
Total Scope 1 and 2 GHG Emissions
In 2017 total Scope 1 and Scope 2 GHG Emissions achieved a reduction of 40.0% from our peak in 2011. This reduction is partly due to decreases in Scope 1 refrigerant efficiency. Reductions in Scope 2 were achieved due to contributions from our solar PV investments.
Total GHG Emission Reductions (tCO2e) (GHG-Dir-Abs and GHG-Indirect-Abs) Year ended 31 March 2013 2014* 2015 2016 2017 % change
from peakScope 1 Emissions 419.0 474.8 132.1 122.7 183.9+ (61.3%) Scope 2 Emissions 6,051.0 5,207.0 4,776.0 4,333.5 3,943+ (42.7%) Total (tCO2e) 6,470.0 5,681.8 4,908.0 4,456.2+ 4,126.9+ n/a - +
- Indicates data reviewed by Deloitte LLP. See page 58 for their independent assurance report
- *
- 2014 was the peak Scope 1 emissions (474.8 tCO2e) benchmark.
Note: 2011 was the peak Scope 2 emissions (6,879.5 tCO2e) benchmark.
Scope 1 emissions from our stores represent only 4.5% of our combined Scope 1 and 2 emissions in 2017. Last year less refrigerant replacement was required for the third year from our peak use in 2014.
Scope 1 and 2 GHG Emission Intensity
Our GHG Emissions ‘intensity’ indicators are based on average customer occupancy (m2), total Group revenue (£) and gross internal floor area (“GIFA” per m2).
Scope 1 and 2 GHG Emission Intensity / Occupancy, Revenue & GIFA (GHG-Int.) Year ended 31 March 2013 2014 2015 2016 2017 % change
from 2011 peakTotal (tCO2e) 6,470.0 5,681.8 4,908.0 4,456.2 4,126.9+ (40.0%) Average Occupancy (m2) 244,521 263,101 283,732 304,964 325,537 64.5% kgCO2e /Occupancy 26.5 21.6 17.3 14.6 12.7+ (63.5%) Revenue (£000) 69,671 72,196 84,276 101,382 109,070 76.3% kgCO2e / Revenue (£) 0.09 0.08 0.06 0.04 0.04+ (63.6%) GIFA (m2) 582,872 582,872 605,419 621,050 629,686 15.4% kgCO2e / GIFA (m2) 11.1 9.7 8.1 7.2 6.6+ (47.6%) - +
- Indicates data reviewed by Deloitte LLP. See page 58 for their independent assurance report.
Note: Peak GHG emissions benchmark was 6,879.5 tCO2e in 2011; Occupancy was 197,884 m2; kgCO2e / Occupancy was 34.8. Revenue was £61,885,000; kgCO2e / £ Revenue was 0.11. GIFA was 545,490; kgCO2e / GIFA m2 was 12.6.
GHG Emission per average occupied space have reduced by 63.5% and GHG emissions per revenue have reduced by 63.6%. GHG emission intensity per GIFA has reduced by 47.6% from our peak. Our future GHG Emission reduction programme is to continue to invest in energy efficiencies and renewable energy, where viable, on new build and acquired stores.
Long Term Energy Scope 1 and Scope 2 GHG Emission Target Review (2008 – 2020)
The Kyoto Protocol Reduction Target (2008 to 2012)
From 2008 to 2010 we achieved store electricity use reductions by investment in our motion sensor lighting and low carbon renewable energy ‘self- supply’. From 2010 to 2013 we had an increase in electricity use as a result of our new store openings and increased customer occupancy. This increase in our emissions delayed the achievement of our 2008 to 2012 Kyoto Protocol Reduction Target of 12.5% until 2014.
The UK Climate Change Act (2008)
The Climate Change Act was made legally binding in the 2009 Budget. It has an interim target of GHG Emission reduction of 34% by 2020. The longer-term target is to reduce GHG Emission by 80% by 2050 (or by approximately 3.5% per year).
Our Target is to Reduce Scope 1 & Scope 2 GHG Emissions by 34% by 2020
Our annual GHG Emission since peak energy use in 2011 has reduced by 35.2% or approximately 5% per year on average.
In order to commit to long-term climate change ‘science-based’ targets we will commit to investing in improved LED technology as they become more efficient, and renewable solar energy on new build stores. This year we acquired two stores at Nine Elms and Twickenham 2, and these stores will be part of our internal and external LED re-lamping programmes in the future. These technologies will achieve levels of decarbonisation required to keep global temperatures on a pathway to 2oC above global pre-industrial levels, by 2100.
Scope 1 and 2 GHG Emission Intensity / Occupancy, Revenue & GIFA (GHG-Int.)
Year ended 31 March2011 2012 2013 2014 2015 2016 2017 2020 Target tCO2e 6,880 6,284 6,470 5,682 4,908 4,456 4,127 4,281* % Reduction 6.1% 3.1% 0.3% 12.4% 24.3% 31.3% 36.4% 34.0% - +
- Indicates data reviewed by Deloitte LLP. See page 58 for their independent assurance report.
- *
- 2008 (Scope 1 and 2) GHG emission (6,487 tCO2e) to reduce by 34% (4,281 tCO2e target).
In 2017, we have achieved a 36.4% reduction in Scope 1 and Scope 2 GHG Emission from 2008, which is an annual average reduction of approximately 4% per year. In 2017 we also reviewed the longer term UK ‘Real Estate Environmental’ target of a 3.5% reduction in GHG Emission, which is now aligned to the Government’s 2050 goal.
Managing the Non-Physical, Physical and Financial Risks of GHG Emission and Climate Change for our Customers, Investors and Other Stakeholders.
Managing the Non-Physical Risks and Opportunities
Over the long term, Big Yellow’s ‘non-physical risks and opportunities’ have been governed by EU and UK regulation and ‘best practice’ within the real estate investment sector. The significance of GHG emission and ‘climate change’ have been reviewed since 2008 within Board Reports and CSR Meetings. Building certifications such as Energy Performance Certificates (“EPCs”), the Building Research Establishment Assessment Methodology (“BREEAM”) and the Considerate Constructors Scheme (“CCS”) are all used in annual investor benchmarks, such as the FTSE4Good; the Carbon Disclosure Project (“CDP”); the Global Real Estate Sustainability Benchmark (“GRESB”).
Financial Risks and Opportunities of Climate Change
The financial risks and opportunities of Climate Change are within the cost of sustainable planning, designing and constructing of our new store developments, which can be more sustainable and resilient in the longer term. The financial risks involve reviewing the existing and acquired stores against extreme weather events such as seasonal storms and flooding. Our investors also appreciate disclosures and performance benchmarks of our portfolio set against sustainable development and energy efficiency benchmarks to assess our annual reduction in carbon emissions and taxes. Internal regulatory briefs on compliance and high standards within real estate benchmarks, makes Big Yellow an efficient and low risk investment.
Physical Risks and Opportunities
The physical risks from increased GHG emission is climate change, global warming, and the consequences of higher risk weather systems that can increase temperatures, storm frequency, flooding and/or droughts.
Big Yellow has physically invested in energy efficiency in order to reduce electricity use and GHG emission. Our solar stores have customer facing electronic screens displaying real time ‘solar generation’ (kWh) and ‘carbon emissions (tCO2) saved’ in customer reception areas.
Big Yellow has also trialled and invested in ‘green roofs’ and ‘green walls’ on several of our stores (Barking, Chiswick, Fulham, High Wycombe and Sutton) in the urban areas of our towns and cities. These investments provide shade to our stores in the summer that are susceptible to the ‘urban heat island effect’. Green roofs can store moisture after rainfall that evaporates in the spring and summer seasons and cools the upper floor levels. ‘Rainwater Harvesting Systems’ are also installed (Barking, Chiswick, Liverpool, Merton, Sheffield and Sutton) in order to provide landscape irrigation in the summer months. Several stores have ‘sustainable urban drainage systems’ that provide permeable car park surfaces or peripheral soft landscaping that can regulate surface water to ground waters and local rivers.
Big Yellow Store Portfolio Asset Certifications
This year we are reporting some of our CSR KPIs and identifying them using the codes from the GRI and EPRA. This is at the request of some of our stakeholders, to assess sustainable development performance.
Certified Assets (EPRA ‘Cert-Tot’ and GRI ‘CRE8’) No. Store EPCs “BREEAM”
CertificationOther
Environmental
InvestmentsSolar
(kWh)
CapacityGross Internal
Floor Area
m21 Balham B GSHP 4kWp 10 kWp 8,361 2 Barking A Green Roof RWH 50 kWp 8,360 3 Birmingham C - - 8,361 4 Bromley B GSHP 15kWp 7 kWp 9,867 5 Camberley A - SUDS 10 kWp 8,849 6 Cambridge B - - 7,264 7 Chiswick B Green Roof 50 kWp 10,678 8 Chester E - - 8,179 9 Ealing B - - 7,887 10 Edinburgh D+ - 26 kWp 8,779 11 Eltham C - - 9,793 12 Enfield B ‘Excellent’ 50 kWp 8,367 13 Fulham B Green Roof; GSHP 28 kWp 19,370 14 Gypsy Corner B - 50 kWp 9,707 15 High Wycombe B Green Roof - 8,431 16 Kennington B GSHP 4 kWp 9,339 17 Liverpool C - RWH - 8,361 18 Merton B GSHP RWH 9 kWp 9,755 19 New Cross B - 50 kWp 8,623 20 Nottingham C - 50 kWp 9,058 21 Oxford 2 D - - 4,266 22 Poole C - - 7,386 23 Reading A ‘Excellent’ SUDS 9 kWp 8,640 24 Richmond B - 18 kWp 4,855 25 Sheen B ‘Excellent’; GSHP 7 kWp 8,919 26 Sheffield Bramall Lane B - RWH - 8,361 27 Sheffield Hillsborough B - - 8,361 28 Stockport B - - 8,288 29 Sutton B Green Roof RWH - 9,755 30 Twickenham A+ - SUDS 16 kWp 10,591 “Green” stores 30 25,926 m2 258,924 m2 73 Total Stores 41% 4.1% 629,686 m2 All stores have energy efficient LED lighting; motion sensor lighting; and automatic electricity meter readers. GSHP: Ground Source Heat Pump, SUDS: Sustainable Urban Drainage System, RWH: Rainwater Harvesting
Energy Performance Certification (“EPC”) Legislation
As owners of property who lease space to members of the public, we are required to display EPCs to our customers from 1 October 2008. Certification is required at new store openings, store acquisitions and when solar panels are retrofitted onto older stores. We have provided 30 EPCs to date in our stores, representing 41% of the portfolio. Of the stores certified 73% have high ‘A’ or ‘B’ ratings, mainly due to energy efficient internal LED re-lamping and investment in low carbon electricity ‘self-supply’, such as solar and ground source heat pump installations. Considering that the whole portfolio has internal energy efficient LED lighting, apart from the two most recent acquisitions, we are comfortable that the pre-October 2008 stores will at least achieve the EPC ‘B’ rating in the future, when the opportunity to rate them arises.
Building Research Establishment Environmental Assessment Methodology (“BREEAM”)
BREEAM certification is a local planning requirement for our stores, especially for new developments in high-density urban environments. The methodology assesses impacts and opportunities for enhancing the design and construction environmental aspects. The certification includes a review of new store energy, sustainable building materials, water efficiency, waste recycling and ecology. The review also includes social aspects of the building life including its resource management, health, well-being, modes of transport and pollution reduction. Our BREEAM ratings are mainly ‘Excellent’ scoring in the 75 – 76% range and highest in the areas of land use and ecology; transport; waste; pollution; and energy efficiency.
- 4.0
-
Scope 3 – Voluntary Supply Chain GHG Emission
Scope 3 supply chain emissions are ‘Greenhouse gases’ from electricity supplier losses during transmission and distribution of electricity to our stores.
Scope 3 – Electricity Supply and Distribution GHG Emission Losses
Year ended 31 March2013 2014 2015 2016 2017 % change
from 2011 peakTotal Electricity Use (kWh) 13,153,960 11,688,629 9,643,341 9,376,085 9,568,862+ (31.3%) Scope 2 (tCO2e) 6,051 5,207 4,776 4,333 3,943+ (41.7%) Scope 3 (tCO2e) 501 445 417 355 357 (34.4%) Total (tCO2e) 6,552 5,652 5,193 4,688 4,300 (41.1%) - +
- Indicates data reviewed by Deloitte LLP. See page 58 for their independent assurance report.
Note: Peak energy use was 2011 (13,925,217 kWh); total CO2e Scope 2 tonnage was 6,758 tCO2e; Scope 3 was 544 tCO2e; and total tonnage was 7,302 tCO2e).
The Transmission and Distribution Conversion Factor for 2017 was 0.03727.
The energy efficiency investment programmes within our stores have reduced electricity demand from our supplier’s power stations. Total transmission and distribution losses (Scope 3 losses) have therefore reduced by 34.4% since 2011.
Scope 3 Store Waste Supply Chain (Recycling & Emissions)
Waste Sources and Segregation
Our main source of waste is from the operational activities of our stores, mainly retail and office activities that have a relatively low environmental impact. Our store staff apply best practice waste segregation for general and mixed dry recyclable materials.
Waste Recycling Contractor
Our recycling contractor provides further segregation and recycling of our waste. Since our ‘total waste’ benchmark of 2011 (244 t) our store portfolio has increased from 62 to 73 stores, and total waste has increased to 325.1 t in 2017, an increase of 33% from 2011. The percentage of waste recycled has reduced from 73% in 2013 to 59% in 2017. This reduction in our contractors recycling is an increasing trend due to a reduction in the supply price of some mixed dry recycled materials, such as paper and cardboard.
Waste to Landfill and Landfill Tax
An increasing amount of ‘General waste’, 130 tonnes (41% of general waste) went to landfill in 2017, as compared to 69 tonnes (28% of general waste) in 2011, an increase of 53% over six years. Landfill Tax is an environmental tax paid in addition to normal landfill costs. Reducing, re-using and recycling waste can reduce the Landfill Tax rate to £2.65 per ton (for more inert waste). If no segregation or recycling occurs, an increase in the tax to £84.40 per ton can apply to more active waste. These changes have increased our landfill tax by 32%, mainly due to the reduction in the market value of our recyclate that is now sent to landfill due to its low price.
Scope 3 – Store Waste Supply Chain Recycling and Landfill Emissions (Waste-Abs)
Year ended 31 March2013 2014 2015 2016 2017 Total Waste (tonnage) 258.5 264.5 272.7 296.2 325.1 Mixed Dry Recycled (t) 189 (73%) 187 (72%) 170 (63%) 176 (60%) 193 (59%) General Waste (t) 69 (27%) 74 (28%) 101 (37%) 118 (40%) 130 (41%) Recycled Mixed Glass (t) – 1.1 1.4 1.4 1.4 Recycled Board/Paper (t) – 2.0 – 1.4 0.7 Waste to Landfill (t) 34.6 37.0 38.2 58.9 130.0 Landfill Tax (£) 6,684 7,054 7,054 9,822 12,913 Landfill GHG (tCO2e)* 10.0 10.7 11.0 17.0 37.5 - *
- The landfill gas conversion factor is 0.289.
Note: 2011 Waste was 244 t; mixed dry recycling was 172 t (70.5%); Landfill was 69 t; GHG emission was 10.8 tCO2e
Landfill Gas Emissions
Our scope 3, ‘supply chain’ landfill-gas emissions have increased by 35% since 2011 (10.8 tCO2e benchmark), to our highest landfill emissions of 37.5 tCO2e in 2017. This year our landfill Greenhouse gas emissions have increased from 17.0 tCO2e (2016) to 37.5 tCO2e (2017). Although these emission levels represent a negligible percentage of our total internal combined Scope 1 and 2 emissions (4,126.9 tCO2e), they will be monitored for future efficiencies.
Scope 3 – Store Waste Supply Chain Costs
Year ended 31 March2013 2014 2015 2016 2017 Mixed Recycling (£) 27,817 28,195 29,897 29,305 43,925 General Waste (£) 20,051 21,163 29,829 30,537 38,740 Total Waste Cost (£) 47,868 49,358 60,040 60,351 83,227 Store generated waste is sorted into four categories of: ‘mixed dry recyclable materials’; ‘general waste’; ‘mixed glass’; ‘paper and cardboard’. The cardboard sector includes our contractor DS Smith with mills in Kent, Birmingham and Manchester.
New Store Construction ‘Fit-Out’ Waste Management Performance (Waste-Abs)
Year ended 31 March2011 2012 2013 2014 2015 2016 2017 Tonnage 147.5 152.3 12.9 78.9 14.5 13.6 0 Waste Recycled (%) 93.2 96.0 100 95 100 92.8 – Plasterboard Recycled (%) 100 34.0 – 100 100 100 – In 2017, there were no new store construction ‘Fit Out’ phases that generated site waste. All of our new stores sign up to the CCS and achieve an EPC ‘B’ rating with LED lighting as standard and roof top solar installations installed where viable.
- 5.0
-
STAKEHOLDERS
Big Yellow engages with all of its main stakeholders to provide information and to gain useful feedback from a variety of groups, as described below.
Government Legislation and Standards
EU Energy Efficiency Directive; ‘The UK Energy Savings Opportunities Scheme’ (“ESOS”)
We appointed an accredited ESOS Assessor, who measured all of our energy consumption and determined significant areas of use. ESOS was enforced by the Environment Agency and involved the audit of four representative stores from our portfolio. We assessed future potential energy savings from the report, other than the technologies that we had already programmed and invested in. We completed the audits in November 2015, before the December 2015 deadline, and have considered changes to our future budget for investing in viable energy saving technologies as a result.
Investor Communications
The Carbon Disclosure Project (“CDP”) 2016
The CDP is a global initiative by investors designed to encourage companies (and their suppliers) to publish information on their carbon emissions and climate change strategies, as a measure of their energy use efficiency. The annual disclosures are in June each year and so we report our 2016 performance in this 2017 CSR Report. The CDP changed its scoring system in 2016 to combine its ‘Disclosure’ score within the ‘Performance’ score as recorded in the table below.
The CDP Performance and Number of Investors Year 2013 2014 2015 2016 2017 Disclosure Score 65/100 67/100 85/100 93/100 – Performance Score B C B C B Number of Investors 534 655 799 884 884 Annual increase in investors – – 10.7% 10.6% – We commit annually to respond to the CDP ‘Investor’ Programme as a benchmark for the ‘Financials’ and ‘Real Estate’ sectors. We have a combined ‘B’ rated score for Disclosure and Performance in 2016, for ‘taking coordinated action on climate change issues’ and ‘implementing current best practice’. Our best performance areas, in descending order, are ‘Management’, ‘Leadership’, ‘Awareness’ and ‘Disclosure’. The ‘C’ Band performance is an average for ‘Financials’ energy efficiency, reductions and targets. Big Yellow’s ‘number of investors’ increased year on year by approximately 10% in 2014 and 2015, but have remained constant in 2016.
The Global Real Estate Sustainability Benchmark (“GRESB”) ‘Green Star Status’
GRESB collects information regarding the sustainability performance of property owning companies and funds. This includes information on performance indicators, such as energy efficiency, GHG emission, water and waste reductions. The Survey also covers broader issues such as sustainability risk assessments, performance improvement, and engagement with employees, customers, suppliers and local communities. GRESB rated Big Yellow with a two ‘Green Star Status’ in 2016. In Europe (and globally) we were scored 79% for ‘management and policy’ and 48% for ‘implementation and measurement’. Our Environmental and Social Governance (“ESG”) was ranked 84% against a peer group average of 54%. The benchmark results ranked Big Yellow as in 1st position out of 8 storage companies and 20th out of 25 UK Listed Real Estate Companies, which allows us to identify the areas where we can improve, both in absolute terms and relative to our peers. We are able to provide our existing and potential investors with information regarding our environmental and social governance performance, in the current real estate investment market.
- 6.0
-
CSR PROGRAMME FOR THE YEAR ENDING 31 MARCH 2018
Big Yellow will continue to focus on its most significant environmental and financial aspects of its business impact, energy use and carbon emissions. Energy efficiency and low carbon supply programmes have been trialled and have been implemented since 2008. We will review and consider further energy reduction strategies within our store operations for carbon and financial savings. For the year ahead our programmes, objectives and targets are highlighted in the table below.
CSR Strategy Programme Objectives From 2011 Benchmark GHG Emission Reduction Assess new and acquired stores within the portfolio for efficient LED re-lamping internally and externally. External store lighting programmed for LED re-lamping in the year ending 31 March 2018. CRC Review potential tax reduction as tCO2 tax rate increases. Implement more specific ESOS advice from our surveys. Increase Solar Energy
GenerationSolar installations to increase with new build portfolio growth, acquisitions and existing retro-fit stores. Solar installation on new build Guildford store and two retro-fit installations on Colchester and Eltham stores. FTSE4 Good
Investor GovernanceProvided data on the Big Yellow web site to update research requests on our supply chain, labour standards and the ‘Modern Slavery Act’. Maintain membership within the FTSE4 Good Index series ratings and engaging with researchers. CDP Communications Use our annual carbon performance data in the CDP survey 2017 to improve our ratings. To increase and maintain our high performance and interest from a wider range of investors. GRESB Maintain our ranking scores in ‘management and policy’ and ‘implementation and measurement’. Strengthen and maintain the leading ‘Green Star’ position in the GRESB upper quadrant. Health and Safety Continually maintain and improve high standards of recording and reporting customer, staff, visitor, and contractor incidents. Invest in continued training and awareness of staff in routine health and safety policy, procedures, management and reporting. Staff CSR Awareness Continue raising CSR awareness through area staff presentations and internal communications. Regular staff meetings and information bulletins on CSR progress and ‘Climate Change’. More details of CSR policies, previous reports and awards can be found on our investor relations web site.
Independent assurance statement by Deloitte LLP (“Deloitte” or “we”) to Big Yellow Group PLC (“Big Yellow”) on selected indicators disclosed within their Corporate Social Responsibility Report 2017 (“Report”)
What we looked at: scope of our work
We have been engaged by Big Yellow to perform limited assurance procedures on selected Group level Corporate Social Responsibility (CSR) performance indicators (“the Subject Matter”) for the year ended 31 March 2017. The assured data are indicated by the + symbol
in the Report.
Carbon footprint indicators:
- >
- Store electricity (tCO2e)
- >
- Store flexi-office gas emissions (tCO2e)
- >
- Refrigerant emissions (tCO2e)
- >
- Absolute carbon dioxide emissions (tCO2e)
Store electricity use, CO2 emissions and carbon intensity:
- >
- Electricity use (kWh)
- >
- Like-for-like electricity use (tCO2e)
- >
- Absolute carbon emissions (tCO2e)
- >
- Carbon intensity (kgCO2e/m2 gross internal area)
- >
- Carbon intensity (kgCO2e/m2 occupied space)
- >
- Carbon intensity (kgCO2e/£ revenue)
Renewable energy generation and CO2 emissions reductions:
- >
- Total renewable energy (kWh)
- >
- Renewable energy percentage of total store use (%)
Staff health and safety:
- >
- Average number of employees
- >
- Minor Injuries
- >
- Reportable injuries (RIDDOR)
- >
- Annual Injury Incidence rate (AIIR) per 100,000 staff
- >
- Notices
What we found: our assurance opinion
Based on the assurance work we performed, nothing has come to our attention that causes us to believe that the selected CSR performance indicators, as noted above, have not been prepared, in all material respects, in accordance with Big Yellow’s reporting criteria.
What standards we used: basis of our work and level of assurance
We carried out limited assurance in accordance with the International Standard on Assurance Engagements 3000 Revised (ISAE 3000). To achieve limited assurance ISAE 3000 requires that we review the processes and systems used to compile the areas on which we provide assurance. This standard requires that we comply with the independence and ethical requirements and to plan and perform our assurance engagement to obtain sufficient appropriate evidence on which to base our limited assurance conclusion. It does not include detailed testing of source data or the operating effectiveness of processes and internal controls. This is designed to give a similar level of assurance to that obtained in the review of interim financial information.
The evaluation criteria used for our assurance are the Big Yellow Group definitions and basis of reporting as described at: http://corporate.bigyellow.co.uk/csr.aspx
What we did: our key assurance procedures
Considering the risk of material error, our multi-disciplinary team of CSR assurance specialists planned and performed our work to obtain all the information and explanations we considered necessary to provide sufficient evidence to support our assurance conclusion. Our work was planned to mirror Big Yellow’s own group level compilation processes, tracing how data for each indicator within our assurance scope was collected, collated and validated by corporate head office and included in the Report.
Key procedures we carried out included:
- >
- Making inquiries of management to obtain an understanding of the overall governance and internal control environment relevant to management and reporting of the subject matter;
- >
- Understanding, analysing, and testing on a sample basis the key structures, systems, processes, procedures, and controls relating to the aggregation, validation and reporting of the subject matter set out above; and
- >
- Reviewing the content of the 2017 CSR Report against the findings of our work and making recommendations for improvement where necessary.
Big Yellow’s responsibilities
The Directors are responsible for the preparation of the Report and for the information and statements contained within it.
They are responsible for determining the CSR goals, performance and for establishing and maintaining appropriate performance management and internal control systems from which the reported information is derived.
Deloitte’s responsibilities, independence and team competencies
Our responsibility is to independently express a conclusion on the performance data for the year ended 31 March 2017. We performed the engagement in accordance with Deloitte’s independence policies, which cover all of the requirements of the International Federation of Accountants Code of Ethics and in some cases are more restrictive. The firm applies the International Standard on Quality Control 1 and accordingly maintains a comprehensive system of quality control including documented policies and procedures regarding compliance with ethical requirements, professional standards and applicable legal and regulatory requirements. We confirm to Big Yellow that we have maintained our independence and objectivity throughout the year, including the fact that there were no events or prohibited services provided which could impair that independence and objectivity in the provision of this engagement.
This report is made solely to Big Yellow in accordance with our engagement letter. Our work has been undertaken so that we might state to the company those matters we are required to state to them in an assurance report and for no other purpose. To the fullest extent permitted by law, we do not accept or assume responsibility to anyone other than Big Yellow for our work, for this report, or for the conclusions we have formed.
Deloitte LLP
London, United Kingdom
22 May 2017