


 32 / 188

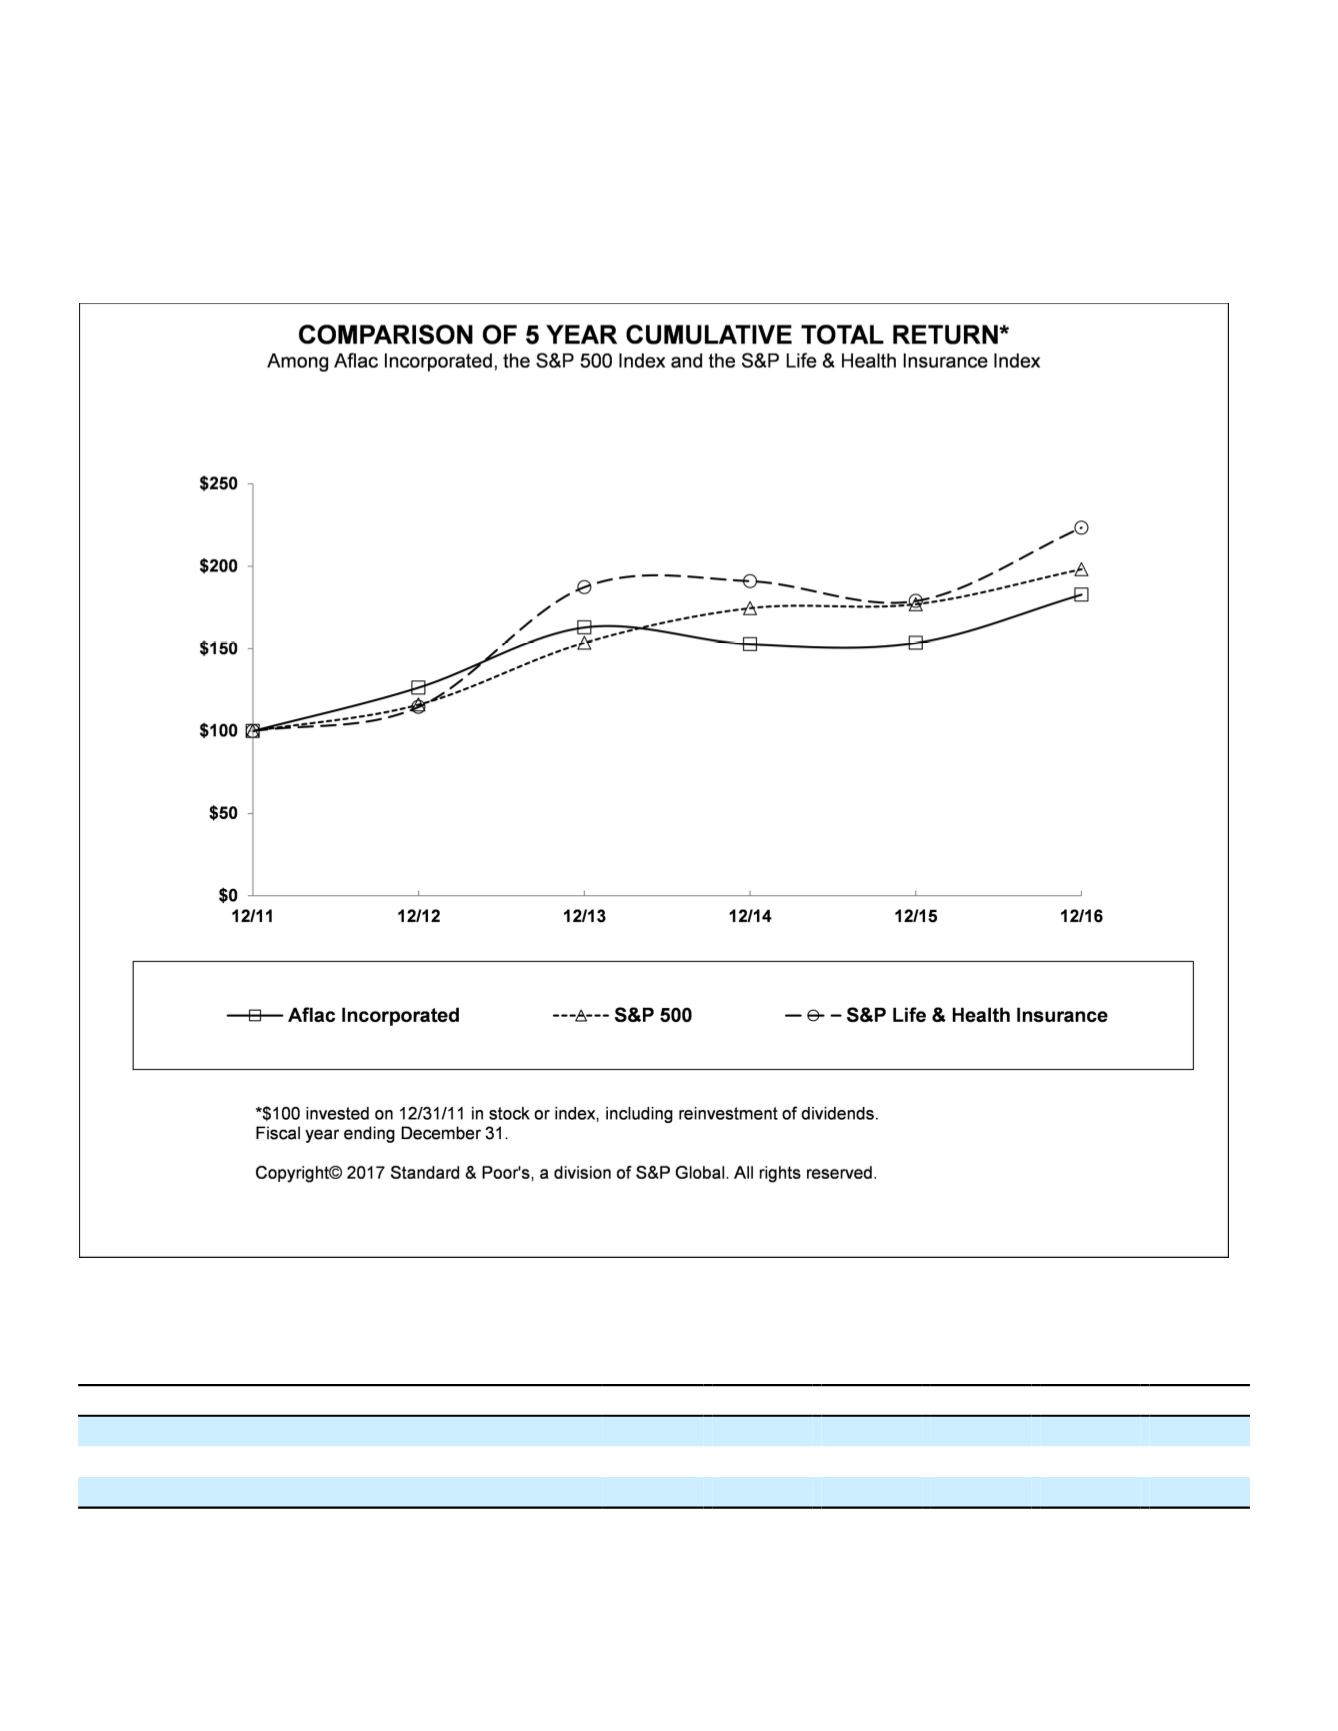
Stock Performance Graph
The following graph compares the five-year performance of the Company's common stock to the Standard &
Poor's 500 Index (S&P 500) and the Standard & Poor's Life and Health Insurance Index (S&P Life and Health). The
Standard & Poor's Life and Health Insurance Index includes: Aflac Incorporated, Lincoln National Corporation, MetLife
Inc., Principal Financial Group Inc., Prudential Financial Inc., Torchmark Corporation and Unum Group.
Performance Graphic Index
December 31,
2011 2012 2013 2014 2015 2016
Aflac Incorporated
100.00 126.36 162.90 152.66 153.45 182.78
S&P 500
100.00 116.00 153.58 174.60 177.01 198.18
S&P Life & Health Insurance
100.00 114.59 187.33 190.98 178.93 223.41
Copyright
©
2017 Standard & Poor’s, a division of The McGraw-Hill Companies Inc. All rights reserved. (
www.researchdatagroup.com/S&P.htm)30