155
Annual Report and Accounts 2014
2012
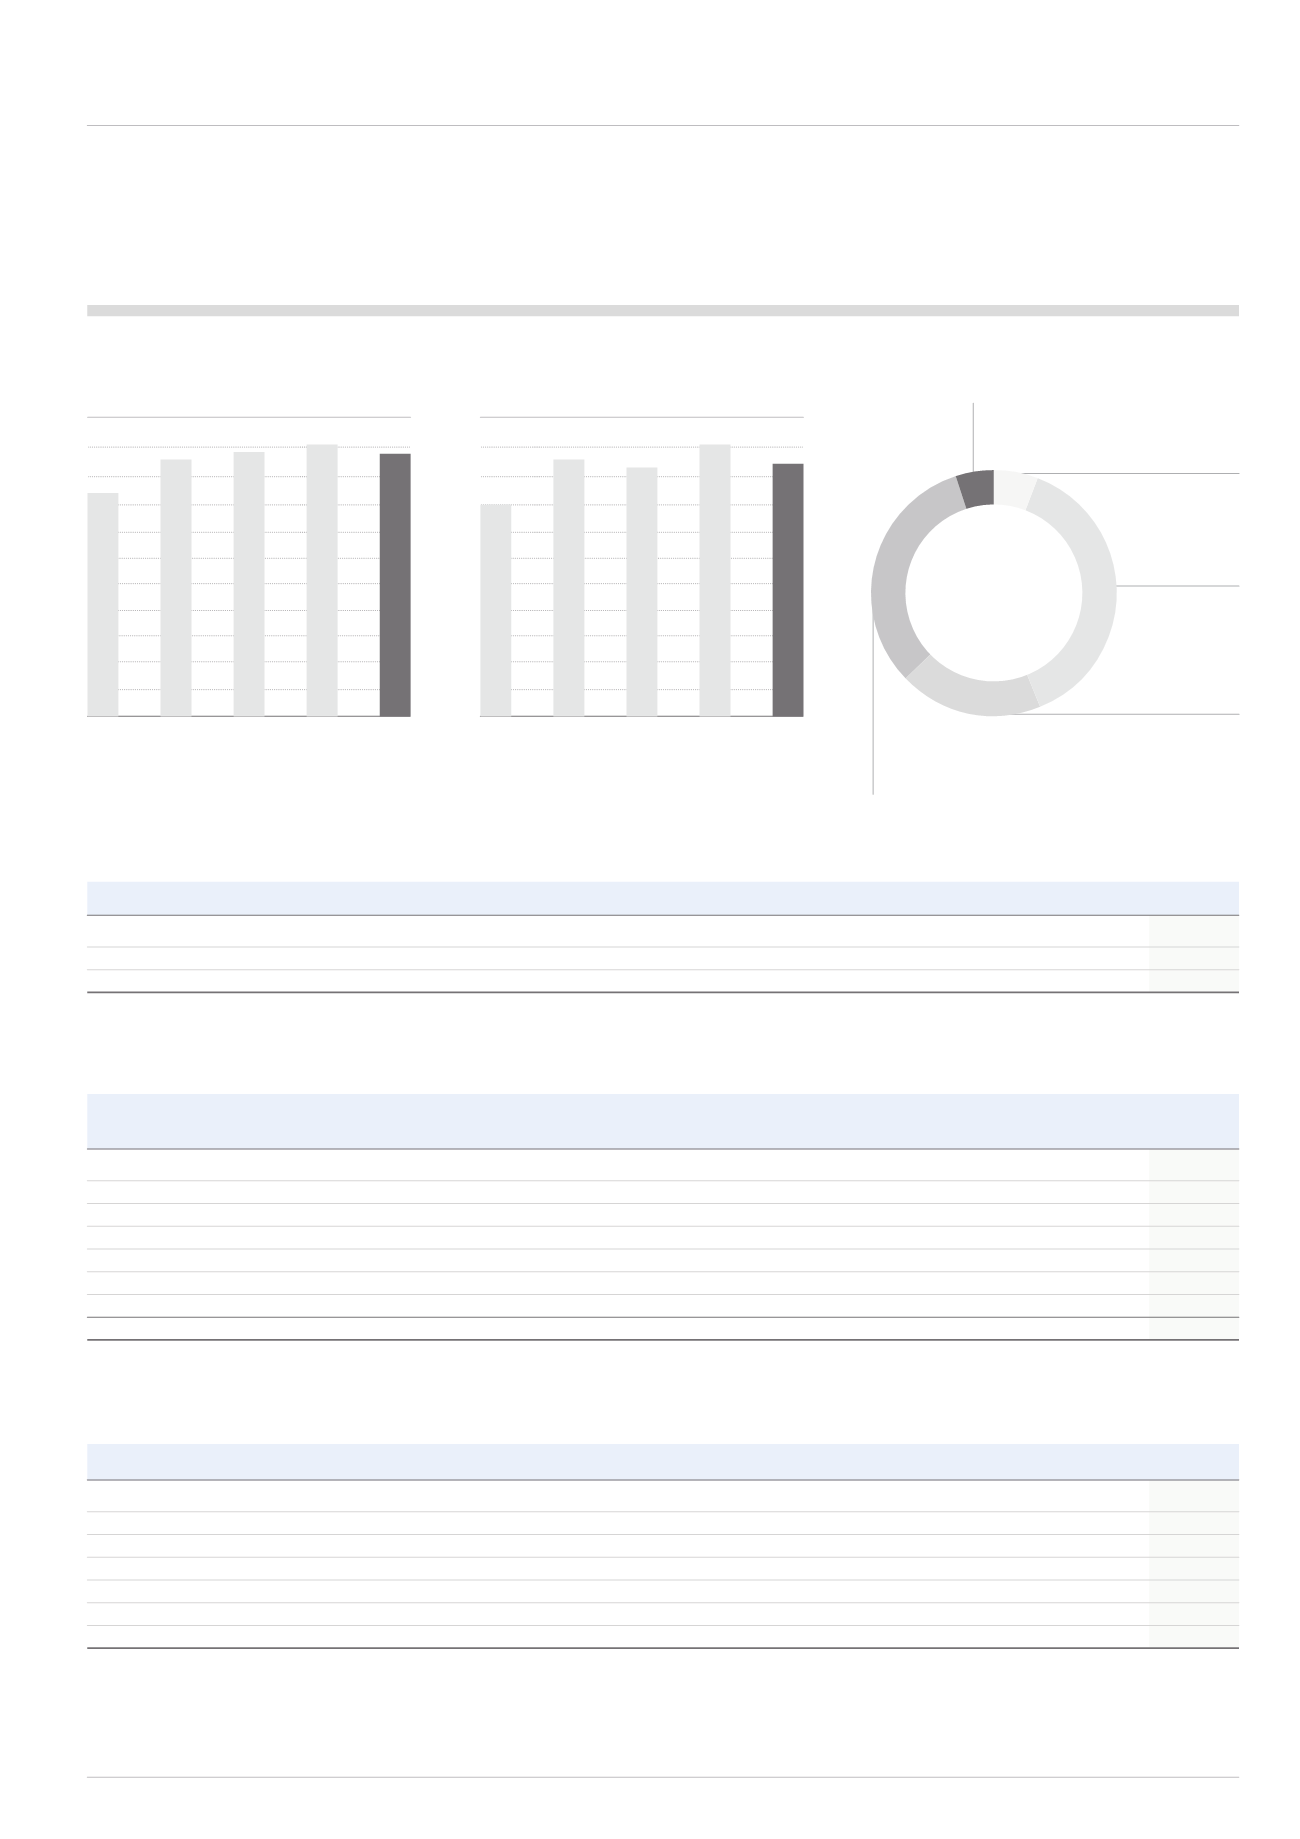
Revenue £m
Adjusted profit before tax* £m
* Before exceptional items.
Continuing revenue by geographic destination 2014
Rest of the
World
5%
Emerging
Markets
32%
North America
19%
Westen Europe
38%
UK
6%
2010
2014
1,686
2010
1,427
2011
1,645
2012
1,694
2013
1,744
2014
278
235
2011
281
275
2013
298
Earnings and dividends
2010
2011
2012
2013
2014
Adjusted earnings per share (continuing)
52.6p
64.5p
64.7p
72.6p
78.0p
Basic earnings per share (continuing)
54.3p
50.5p
53.9p
60.4p
69.2p
Ordinary dividend per share
26.0p
30.0p
32.5p
35.3p
37.6p
Balance sheet
2010
2011
2012
2013
2014
£m
£m
£m
£m
£m
Segmental net assets
Continuing
791
806
906
897
849
Discontinued
194
192
189
196
-
Other net non-operating liabilities excluding borrowings
(264)
(275)
(267)
(246)
(95)
Net debt
Continuing
(164)
(127)
(160)
(226)
(200)
Discontinued
19
18
16
27
-
Net assets
576
614
684
648
554
Statistics
2010
2011
2012
2013
2014
Segmental operating profit as a percentage of segmental revenue
18.3% 18.7% 17.7% 18.4%
17.5%
Segmental operating profit as a percentage of segmental net assets
33.2% 38.2% 33.1% 35.9%
34.8%
Effective tax rate on adjusted profit before tax
28.0% 26.0% 24.0% 22.0%
22.0%
Net assets per share (excluding treasury and EBT shares)
181.9p 193.5p 214.0p 210.0p
218.4p
Net debt as a percentage of shareholders’ funds
28.5% 20.7% 23.4% 34.9%
36.1%
Net debt: EBITDA**
0.5
0.4
0.5
0.7
0.5
EBITDA: Interest
21
19
18
21
26
** For 2014, net debt to EBITDA excluding disposal gains and one off pension gains was 0.6 times.


