4,511
Percentages in the above tables are percentages of salary.
M W Selway
R M Twite
D J Shook
Salary
770
770
770
Pension
30%
30%
30%
Benefits
45
45
45
Annual Incentive Bonus
0%
100%
200%
IIP
0%
62.5%
250%
Salary
400
400
400
Pension
20%
20%
20%
Benefits*
-
-
-
Annual Incentive Bonus
0%
62.5%
125%
IIP
0%
37.5%
150%
Salary
445
445
445
Pension
35%
35%
35%
Benefits
19
19
19
Annual Incentive Bonus
0%
75%
150%
IIP
0%
50%
200%
Long-term incentives
Bonus
Fixed pay
Long-term incentives
Bonus
Fixed pay
Long-term incentives
Bonus
Fixed pay
100%
100%
100%
45%
23%
53%
55%
5,000
3,000
3,000
2,500
2,500
4,000
2,000
2,000
3,000
1,500
1,500
2,000
1,000
1,000
1,000
500
500
Minimum
Minimum
Minimum
£000
£000
£000
On-target
On-target
On-target
Maximum
Maximum
Maximum
34%
34%
43%
28%
28%
21%
19%
17%
1,046
620
480
2,297
1,176
880
2,177
1,580
Directors’ Remuneration Report (cont’d)
Illustrations of the application of
IMI’s remuneration policy
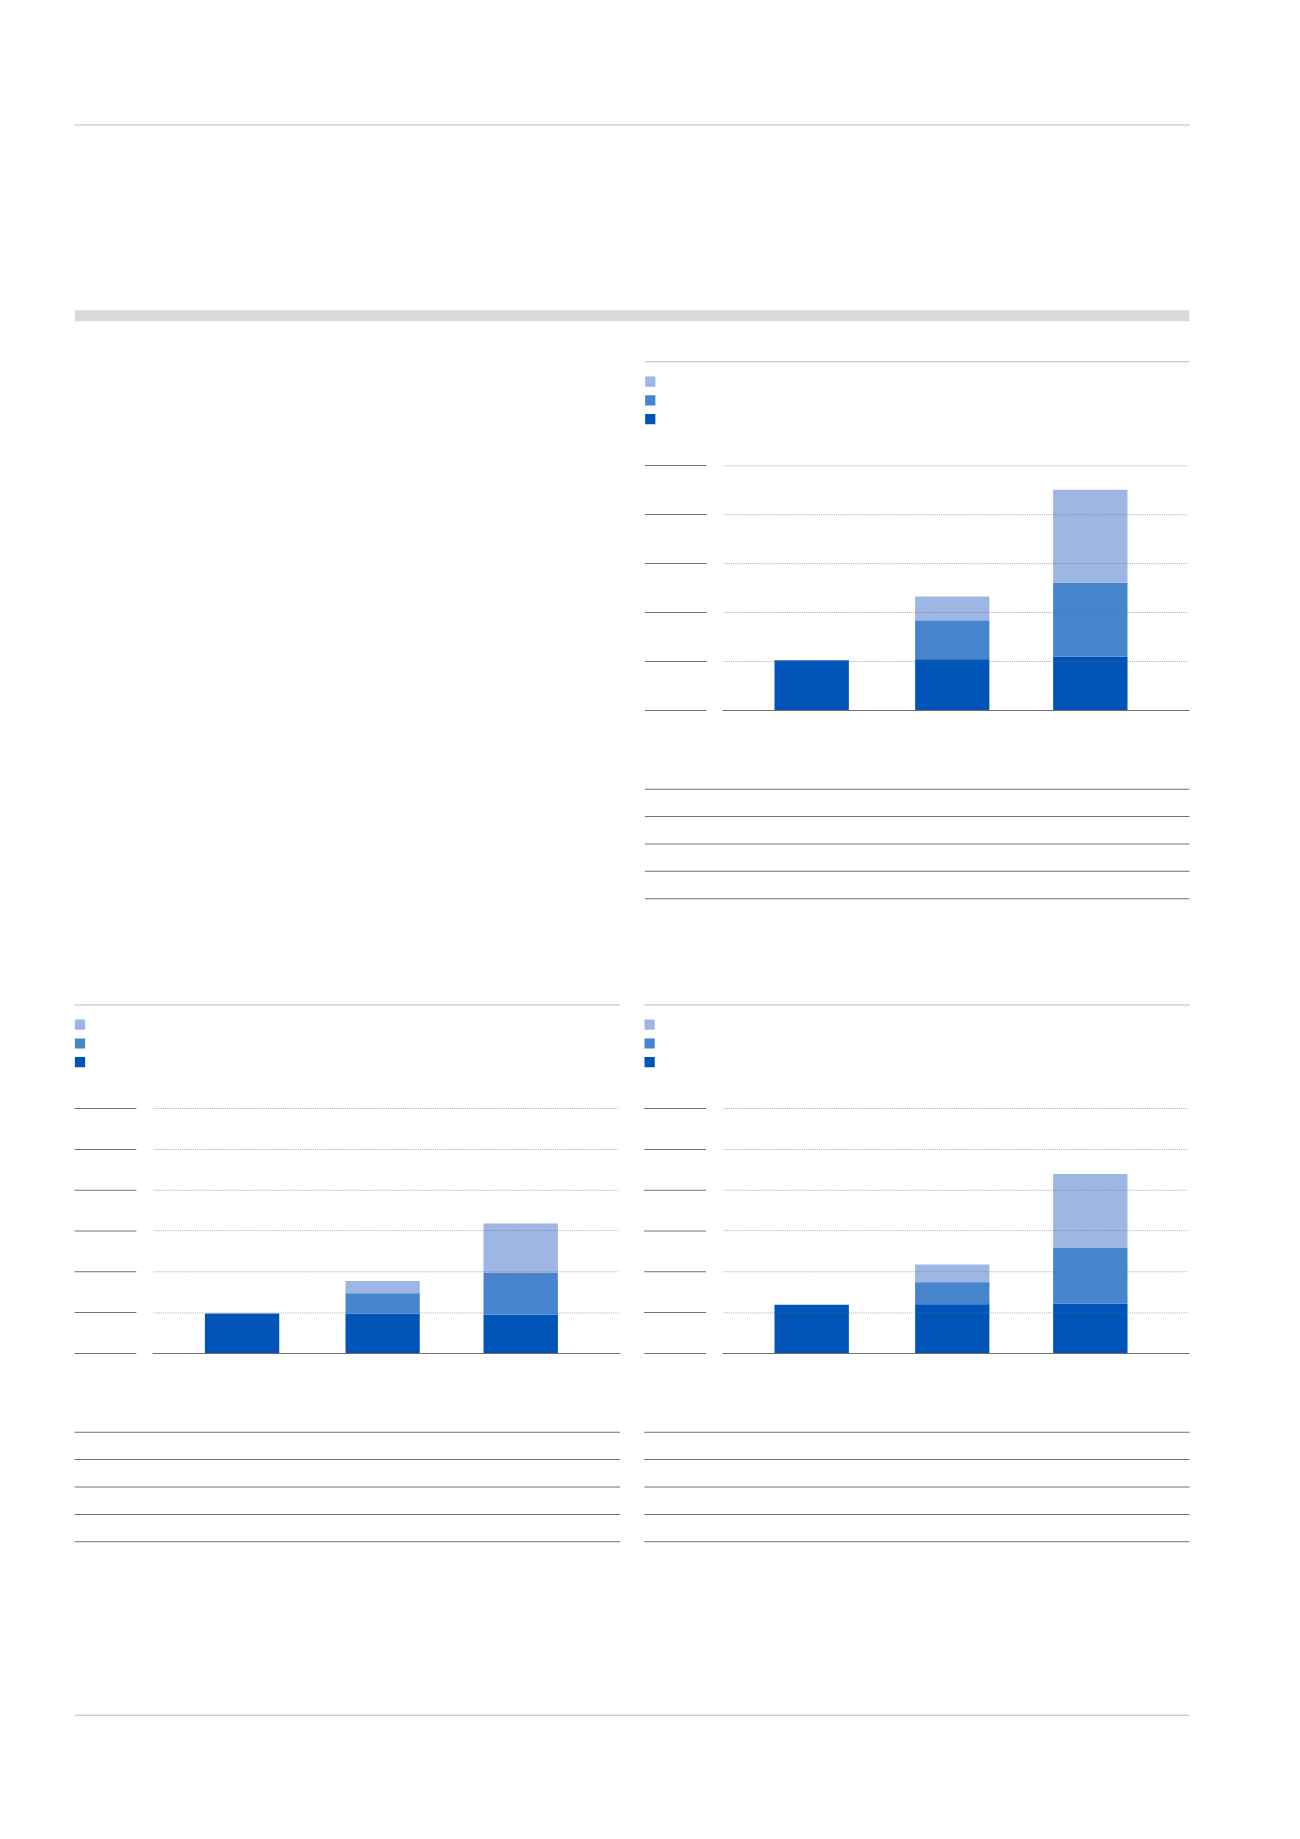
To illustrate the opportunity available to our executive directors,
and the sensitivity of pay to performance, the adjacent graphs
set out pay outcomes for three performance scenarios:
• minimum, where pay is limited to fixed, non-performance
related components (based on 2015 salaries and the
corresponding pension and benefits as disclosed in 2014);
• ‘on-target’, where bonus vests at target levels for each
executive, and long-term incentives vest at threshold
(assuming targets are calibrated such that the lower end
of the vesting schedule is representative of ‘on-target’); and
• maximum, where all variable pay components vest in full.
The charts are based on proposed IIP awards for 2015 in
accordance with the policy subject to approval. No share price
growth or dividend assumptions are made and all-employee
share plans are excluded.
30%
32%
38%
28%
31%
41%
* D J Shook did not receive any benefits in 2014
60
IMI plc


