Comparative data
The following information is intended to provide additional context
regarding the total remuneration for executive directors.
Relative importance of pay spend
In 2014, the total dividend for the year of 37.6 pence represented
an increase of 7% over last year’s 35.3 pence. As a result of the
sale of the Retail Dispense divisions an additional special return
of £620m was made to shareholders in 2014 and there was a
consolidation of the Group’s equity with the issue of seven new
shares for every eight held. During the same period the total
pay spend decreased by 15% reflecting the sale of the Retail
Dispense divisions.
Relative percentage change in remuneration for
Chief Executive
Mark Selway was appointed Chief Executive designate in
October 2013 and was not considered for an increase in base
salary for 2014. As such, his appointment as Chief Executive
during the year under review means that it is not possible to
provide a comparison this year. We will revert to normal practice
next year when comparable data is available.
The Committee actively considers any increases in base
pay for the Chief Executive relative to the broader employee
population. However, benefits and bonus payments are not
typically compared given they are driven by a far broader
range of factors, such as local practices, eligibility, individual
circumstances and role.
Historical performance and remuneration
In addition to considering executive remuneration in the context
of internal comparisons, the Committee reviews annually
historical outcomes under the variable pay plans.
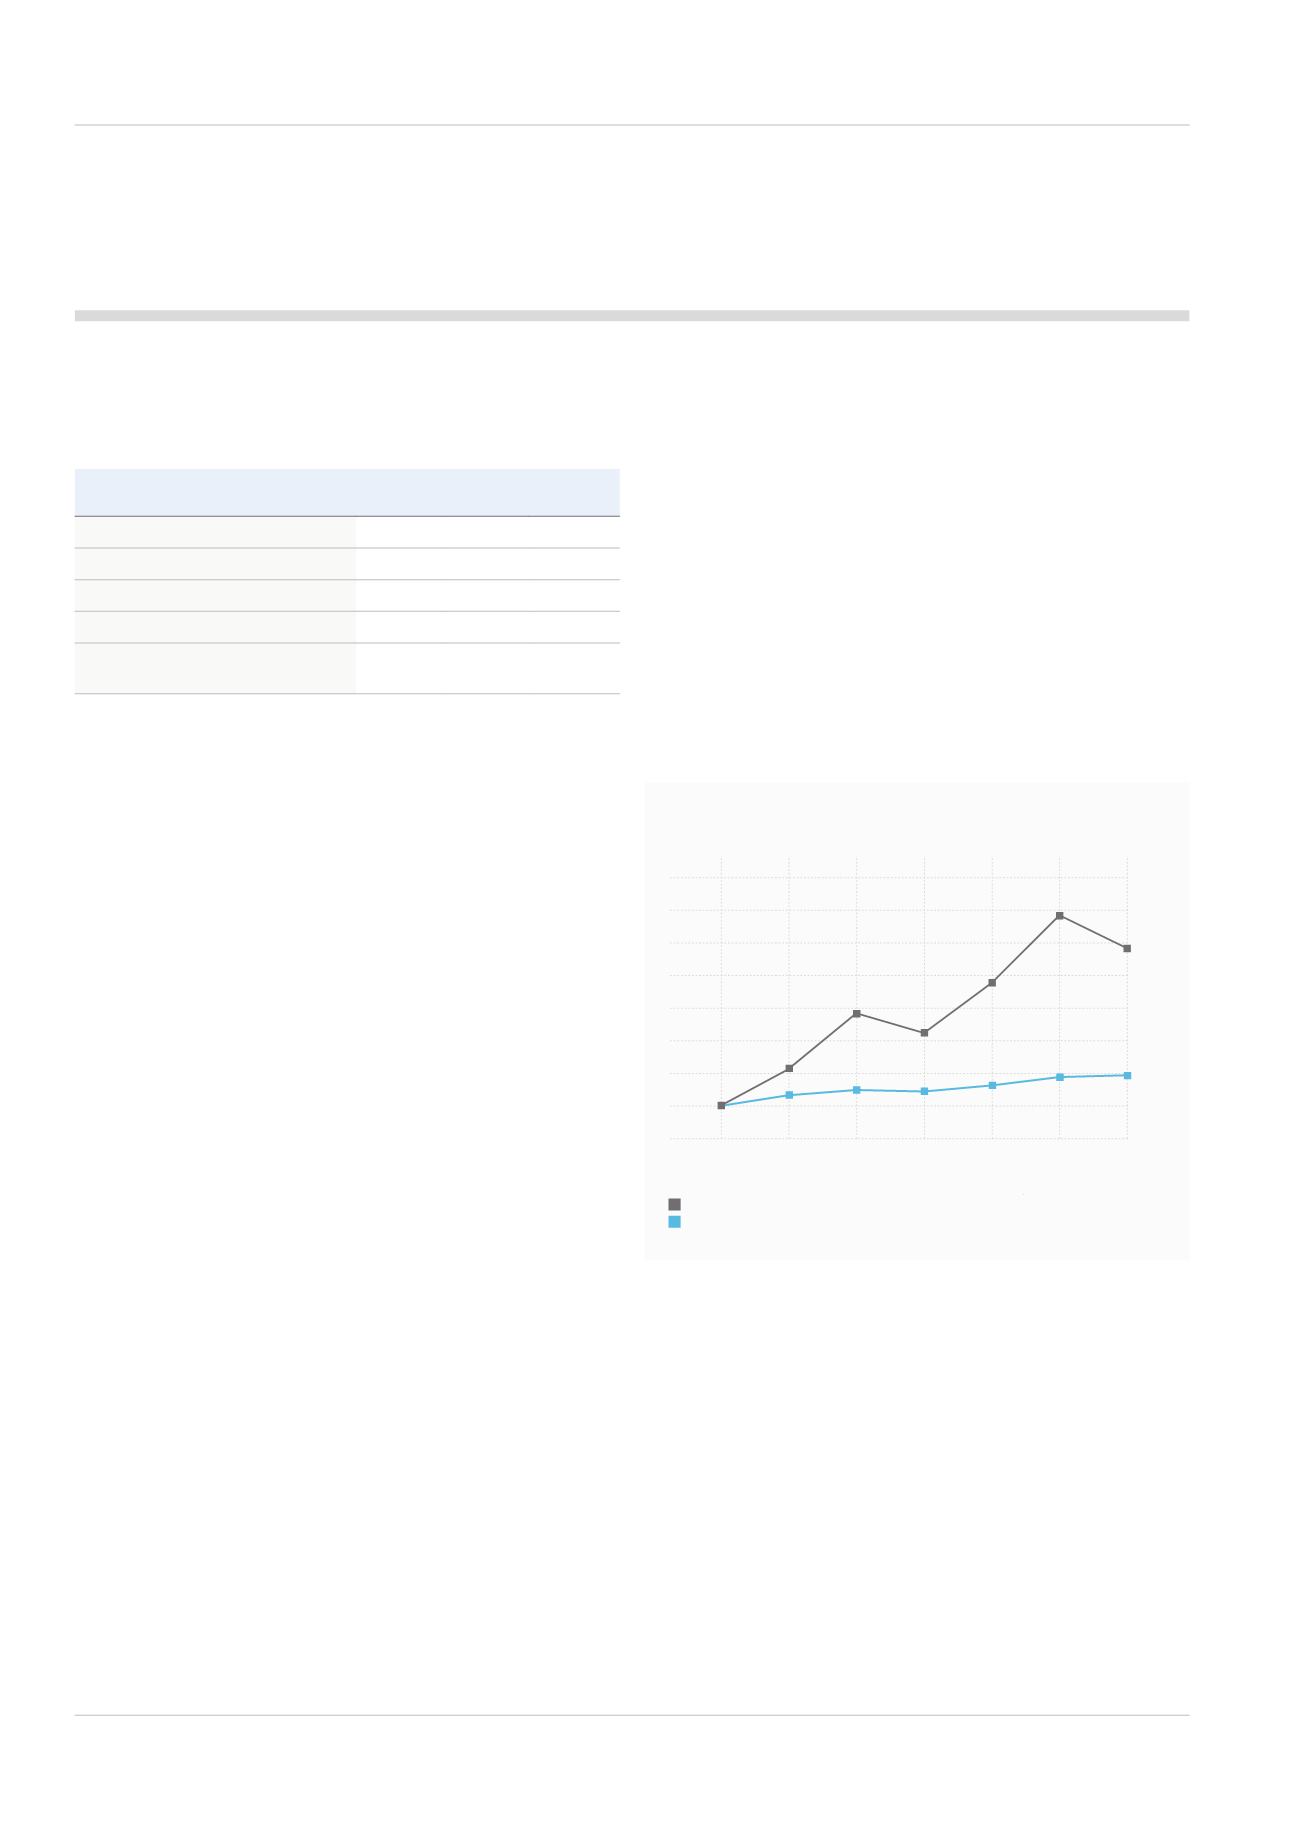
The following graph compares IMI’s TSR to the FTSE100 over
the last six years. We compare performance to the FTSE100
as it represents the broad market index within which IMI shares
are traded. TSR measures the returns that a company has
provided for its shareholders, reflecting share price movements
and assuming reinvestment of dividends (source: DataStream),
with data averaged over the final 30 days of each financial year.
As the graph below illustrates, IMI’s absolute and relative TSR
performance has been strong over the last six years. This is
reflected in the outcomes under our variable pay plans, which
are largely driven by the financial performance of the Group
and IMI’s share price.
2014
£m
2013
£m
Change
Acquisitions
-
7.8
-100%
Dividends
97.3
106.2
-8%
Return of Cash
620.3
-
-
Purchase of own shares
40.0
195.7
-80%
Total employment costs for Group*
(see Section 2.1.3 on page 97)
535.5
630.1
-15%
400
300
200
500
100
0
600
£580
£195
700
800
£
2008
2009
2010
2011
2012
2013
2014
IMI
FTSE100
Total return from a hypothetical £100 investment
Directors’ Remuneration Report (cont’d)
* As per Companies Act requirements, the total employment costs for the Group reported in 2013 included the Retail
Dispense divisions. The total employment cost in 2013 excluding Retail Dispense was £505.2m.
70
IMI plc


