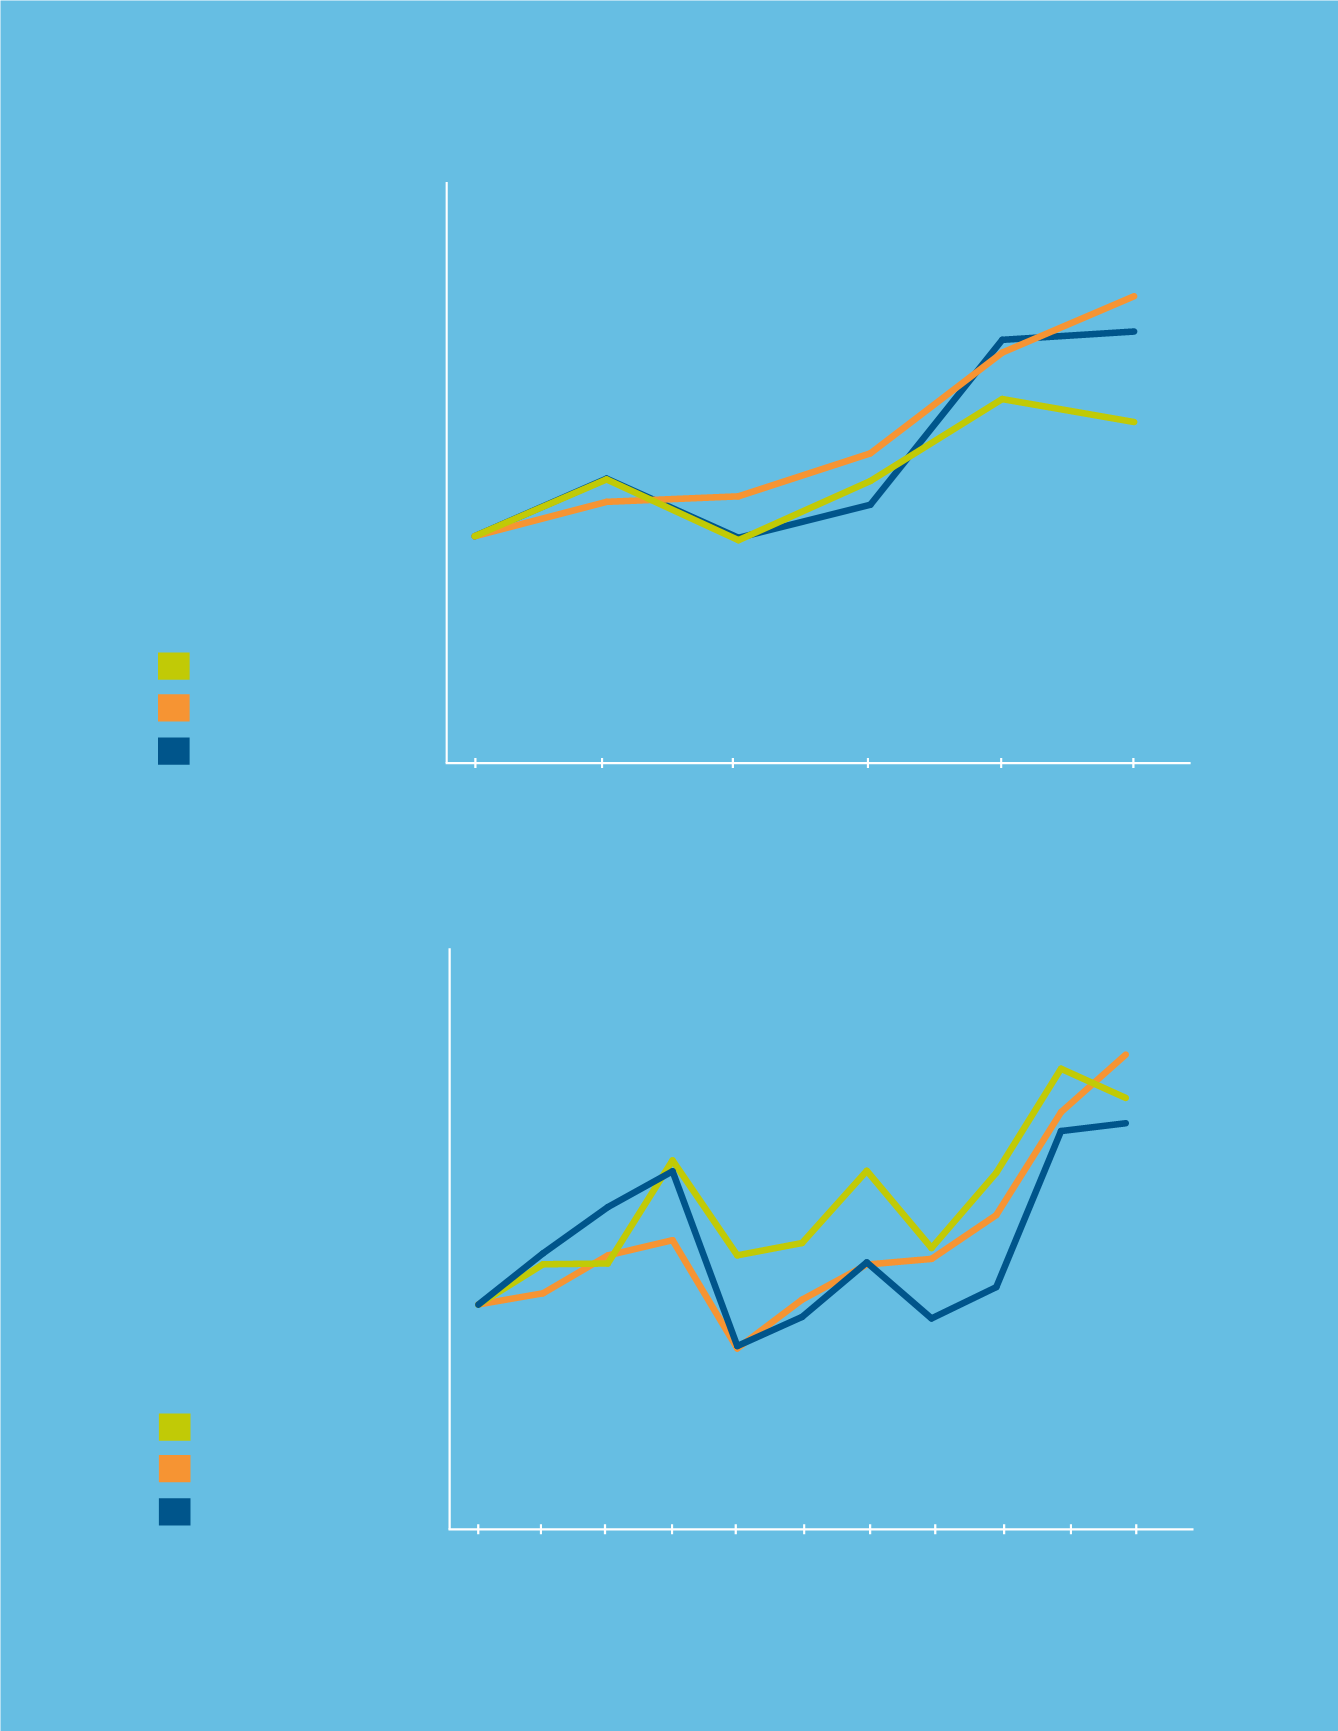

*$100 invested on December 31, 2004, in stock or index, including reinvestment of dividends. Fiscal year ending December 31.
Copyright © 2015 Standard & Poor’s, a division of The McGraw-Hill Companies, Inc. All rights reserved.
2004
2005
2006
2007
2008
2009
2010
2011
2012
2013
2014
100.00 117.73 118.07 163.23 121.63 127.04 158.66 124.85 157.76 203.38 190.59
100.00 104.91 121.48 128.16 80.74
102.11 117.49 119.97 139.17 184.25 209.47
1100.00 122.51 142.74 158.45 81.89
94.64 118.54 93.99
107.71 176.08 179.50
S&P 500
Aflac Incorporated
S&P Life & Health Insurance
0
50
100
150
200
$250
Among Aflac
Incorporated,
the S&P 500 Index
and the S&P Life &
Health Insurance Index
Among Aflac
Incorporated,
the S&P 500 Index
and the S&P Life &
Health Insurance Index
Comparison of Ten-Year Cumulative Total Return*
*$100 invested on December 31, 2009, in stock or index, including reinvestment of dividends. Fiscal year ending December 31.
Copyright © 2015 Standard & Poor’s, a division of The McGraw-Hill Companies, Inc. All rights reserved.
Comparison of Five-Year Cumulative Total Return*
2009
2010
2011
2012
2013
2014
100.00
124.89
98.27
124.18
160.09
150.03
100.00
115.06
117.49
136.30
180.44
205.14
100.00
125.25
99.31
113.80
186.04
189.67
S&P 500
Aflac Incorporated
S&P Life & Health Insurance
0
50
100
150
200
$250
2009
2010
2011
2012
2013
2014
100.00
124.89
98.27
124.18
160.09
150.03
100.00
115.06
117.49
136.30
180.44
205.14
100.00
125.25
99.31
113.80
186.04
189.67
S&P 500
Aflac Incorporated
S&P Life & Health Insurance
0
50
100
150
200
$250
33


