Case study
Impressive results have been
achieved on changeover time
reduction and assembly line
balancing in our factory in Ljung,
Sweden where ‘One Piece Flow’
has been implemented, meaning
that there is only one part or job
in each workstation. This reduces
work in progress and lead time.
Our teams have received comprehensive
training and support in order to secure
engagement for the planned lean
transformation. Internal benchmarking
has taken place and experience across
sites has been shared in order to
accelerate the pace of improvement.
The lean concept at Hydronic
Engineering goes beyond manufacturing
excellence and embraces the whole
supply chain and sales process.
Results have been impressive – our on
time delivery rate has moved to over
90% and the reliability of our machines
and processes are getting close to
world-class targets.
All five factories in Europe demonstrated
progress in the implementation of key
lean processes and achieved over 50%
scoring on their second assessments.
Our show-case Poland site achieved
particularly impressive results and
reached 74%, the highest lean score
across the Group.
Another important step has been the
integration of the division’s factories
and warehouses in a connected value
stream, reducing inventories and
customer lead time.
The objective for 2015 includes the
adoption of strategy deployment across
all Hydronic Engineering businesses.
The process uses the key critical
strategic priorities and builds a
structured plan to disseminate the
actions across every plant and engage
every employee through the division.
Team members were pleased to demonstrate their
progress in ‘One Piece Flow’ and on time delivery rates
to non-executive director, Carl-Peter Forster, when he
visited Hydronic Engineering in Poland.
Product
line
Before
After
Improvement
STAF
2.1
pieces/
hour
5.3
pieces/
hour
152%
STAP
2.7
pieces/
hour
5.8
pieces/
hour
115%
Mätventil
2.2
pieces/
hour
5.4
pieces/
hour
145%
19
Strategic Review
Performance Review
Corporate Governance
Financial Statements
Introduction
Annual Report and Accounts 2014
Site Key:
1
IMI Hydronic Slovenia
2
IMI Hydronic Poland
3
IMI Hydronic Poland - warehouse
4
IMI Hydronic Sweden - warehouse
5
IMI Hydronic Germany - warehouse
6
IMI Hydronic Germany
7
IMI Hydronic Switzerland
8
IMI Hydronic Sweden
9
IMI Hydronic North America
69
55
47
50
61
45
51
56
36
66
68
55
53
74
49
54
56
51
% score
Lean assessments
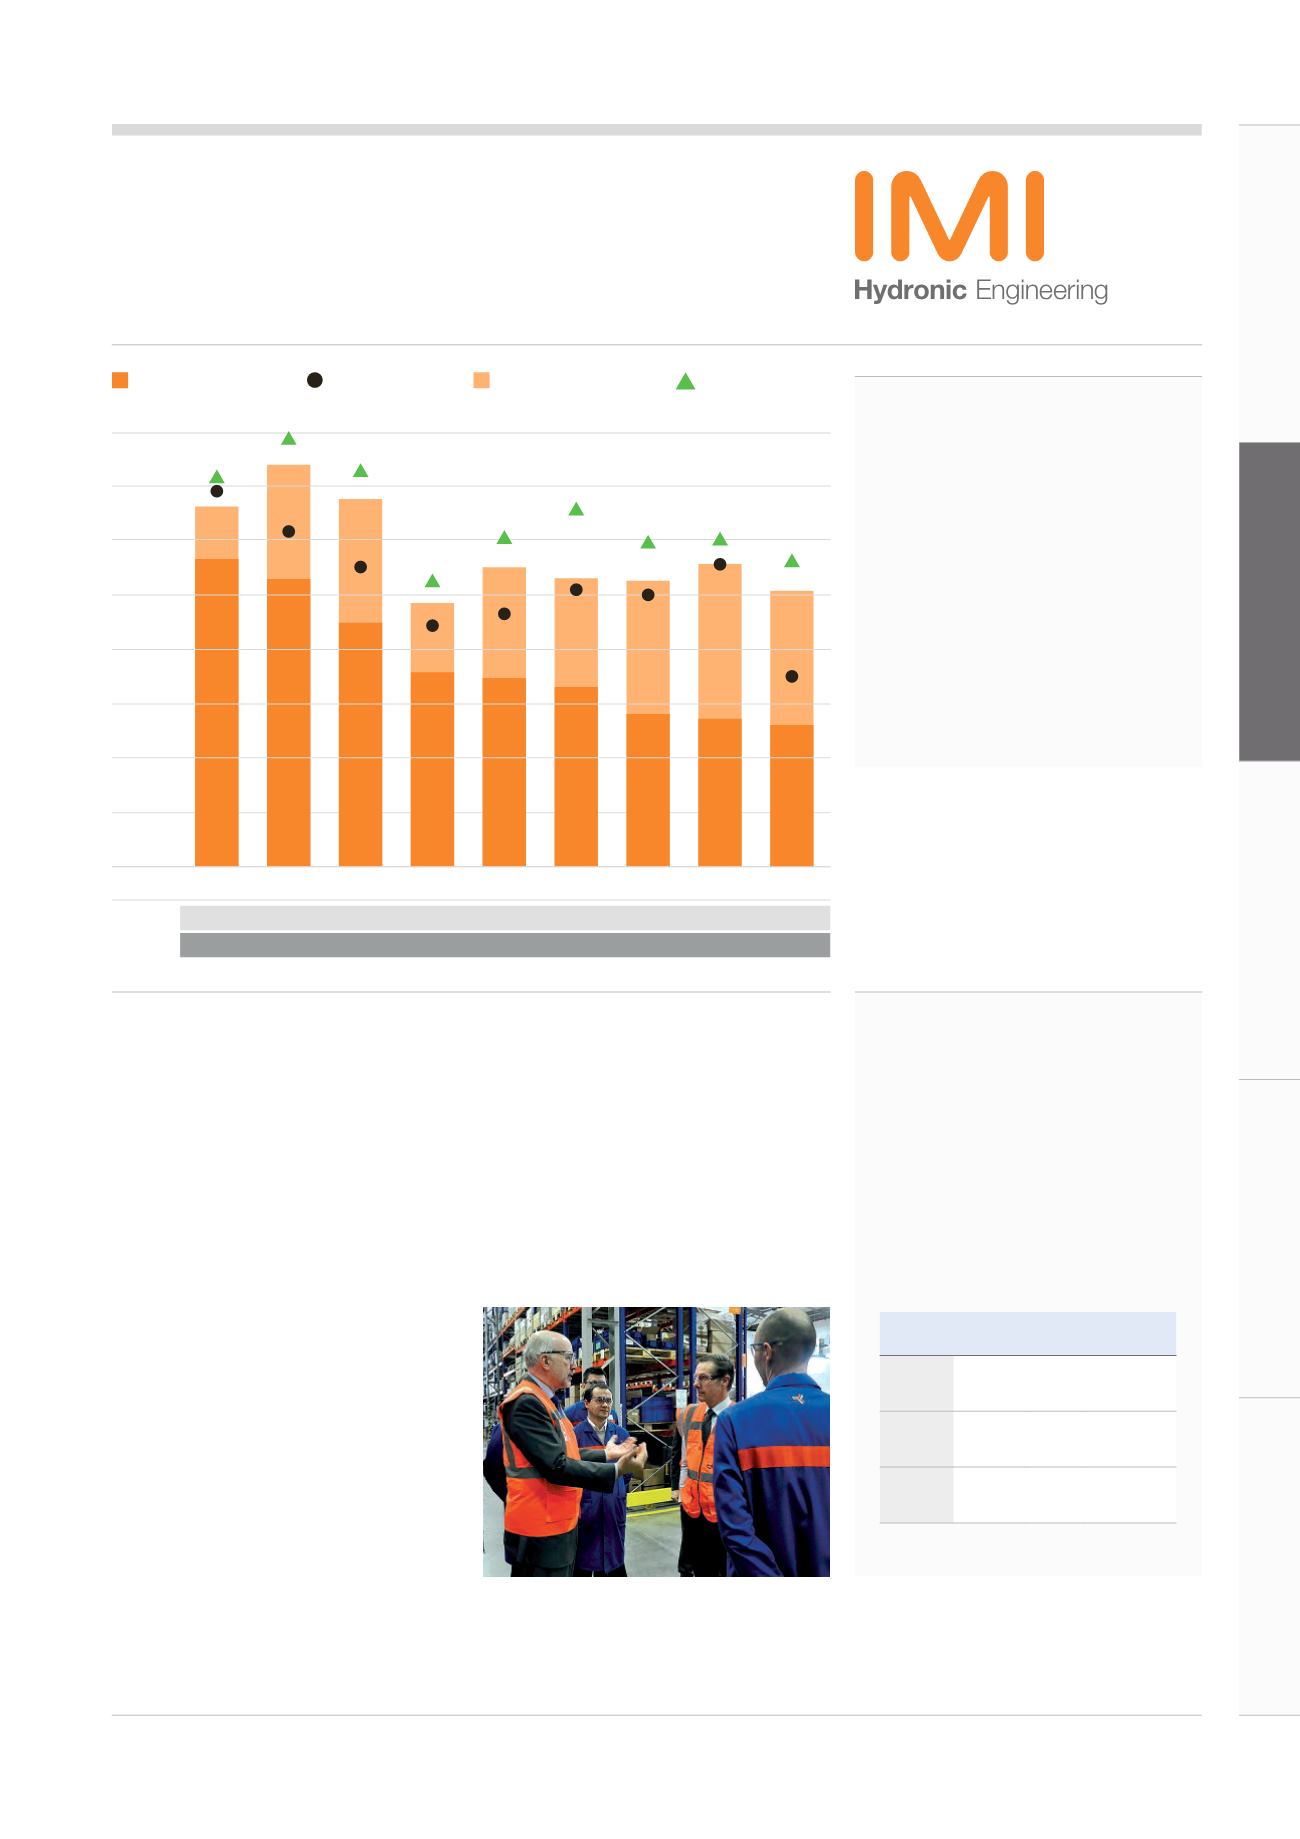
During 2014, our Hydronic Engineering sites were benchmarked against
the ten areas of lean and the average score of the division’s first round of
assessments was 38%. Improvement targets were set and plants have now been
benchmarked for a second time, this time scoring an average of 59%. Plans are
in place to improve this score to an average of 63% in the first half of 2015.
80
70
60
50
40
30
20
10
1
st
assessment score
Next improvement
target
2
nd
assessment score
1
st
improvement
target
1
7
2
8
3
9
4
5
6
Site
1
st
improvement
target%
2
nd
assessment
score%


