Download centre
Strategic report
Governance
Financial statements
- Independent Auditor’s Report
- Consolidated Income Statement
- Balance Sheets
- Statement of Changes in Equity
- Cash Flow Statements
- Notes to the Consolidated Cash Flow Statement
- Notes to the Consolidated Financial Statements
- Morses Club PLC Information for Shareholders
Full Annual Report
 Annual Report 2017
-
Strategic report CFO's operational and Financial Review
The Group’s financial performance continues to reflect our underlying aims of controlled growth through responsible lending, with a continued focus on impairment, improving the quality of our customer base. We believe this leads to higher returns on assets and improved shareholder returns.
The results for the Group for the 52 weeks to 25 February 2017 illustrate our aim of controlled growth, with credit issued up by 18%, revenue up by 10% and adjusted profit before tax up by 5%. Statutory profit before tax is also up 8%. Impairment as a percentage of revenue of 24.4% (FY16: 20.8%) remains comfortably within our guidance range of 22.0% to 27.0%. Despite the increased costs of compliance and PLC status, the ratio of total operating costs to revenue decreased by 7% because the benefits of our scale and improved technology drove greater efficiencies.
Net tangible assets, being net assets less intangible assets arising from acquisitions, plus capitalised software, increased by 14% to £54.4m with the net receivables growing by 8% to £61.2m. The value of gross customer receivables with our top performing customers increased by 10%.
Group Results
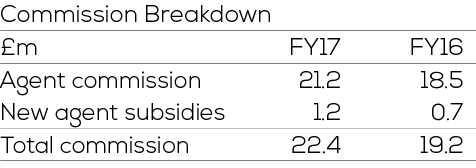
Credit issued to customers for the year increased by 18% to £144.1m (FY16: £122.2m) of which 5% can be attributed to acquisitions made during this period. Core growth reflected a successful territory build strategy in which we carried out 105 builds in the year and their quality remains strong. Revenue increased by 10% to £99.6m (FY16: £90.6m) while the cost of collections rose by 17% to £22.4m (FY16: £19.2m), representing 22.5% (FY16: 21.2%) of revenue. There are several reasons for the disproportionate increase in collection costs. Firstly, the cost of increased territory build subsidies to agents joining from competitors accounted for £1.2m compared with £0.7m last year. Management’s view is that this is a business development cost as new territory builds are usually loss-making in the first year, but result in high-quality profitable customers thereafter. Secondly, agents inherited from acquisitions are generally more expensive, creating an estimated cost increase of £0.5m this year (FY16: £0.1m). Finally, shortening the average loan duration, and therefore the finance charges, decreases the income to cash yield, making the commission paid (this is cash-based) relatively more expensive.
-
Strategic report CFO's operational and Financial Review
Impairment of £24.3m (FY16: £18.8m) was 29% higher than last year, increasing as a percentage of revenue from 20.8% to 24.4%.
This increase reflects the very low impairment in the prior year due to modest growth in credit issued in the first half of that year and the second half of the year before. These lower levels of growth are attributable to the acquisition and integration of the Shopacheck Financial Services business at the time. This was a major undertaking and meant that management were focused on assessing the customer base that we had inherited and harmonising IT systems, credit policy and other processes and procedures rather than on new customer growth.
This current impairment level is still well within our concept of an appropriate range of 22% to 27% for an established Home Collected Credit (HCC) business.
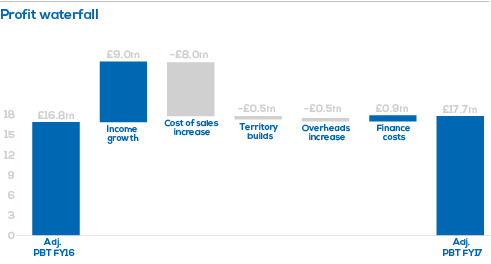
Impairment is arguably more closely related to credit issued, and on this metric the level of impairment of 16.8% of credit issued is only slightly higher than 15.4% of credit issued last year. Overheads of £34.6m were broadly in line with last year’s £34.1m, despite increased costs associated with being a listed company and the increased investment in compliance activities. The continued focus on improving operational efficiency resulted in the reduction of overheads as a percentage of revenue from 37.6% last year to 35.1% this year, an efficiency improvement of 7%.
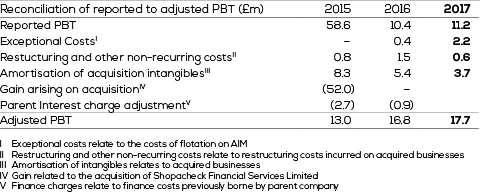
The adjusted profit before tax increased to £17.7m from £16.8m last year, an improvement of 5%. Adjusted earnings per share increased to 10.8p from 10.2p last year.
Reported profit before tax increased to £11.2m from £10.4m last year, an improvement of 8%.
-
Strategic report CFO's operational and Financial Review
The amortisation of intangibles reflects the unwind of intangible assets in connection with acquisitions. This reduction reflects both the lower level of acquisitions in the current year and reduced levels of amortisation in connection with prior year acquisitions. Intangible assets are amortised over their useful economic life, which is based on the expected life of the acquired customer relationships. Due to the behavioural profile of our customers, this will naturally result in a greater amortisation charge in the early years, with a corresponding reduction in later years. No intangible asset is recognised for new customers agents may identify subsequently, which management considers to be a conservative approach.
In FY17, the business incurred costs of £2.2m in connection with its IPO on 5 May 2016.
Other non-operating costs are primarily in connection with non-recurring restructuring costs of the business and were higher in FY16 due to the costs associated with integrating the Shopacheck Financial Services business into Morses Club.
Online Lending
The additional costs associated with establishing our online lending facility were less than £0.1m and have therefore not been separated out from the core business performance.
Return on Equity
The Group calculates its return on equity (ROE) as profit before tax, amortisation of intangible assets arising on acquisitions, the one-off costs of the IPO and other non-operating costs as a percentage of the average book value of the shareholder funds during the period. The Group achieved an impressive 27.2% (FY16: 27.9%) for the current year, a particularly pleasing result given the low gearing level by comparison with our peers.
Net Margin
The adjusted net margin, which excludes amortisation of intangibles on acquisitions, the one-off costs of the IPO and other non-operating costs, decreased to 17.7% compared to 18.6% last year, primarily due to sales growth and investment in our business.
Because credit-issued growth exceeded revenue growth and given that impairment is closely related to sales, the like-for-like impact of impairment cost to revenue on margin reduced it by 1.7%. Furthermore, the additional cost of the agent commission subsidies impacted net margins by 1.2% against only 0.8% in the previous year.
The net margin for the period decreased only slightly to 11.3% from 11.5% last year as the amortisation of intangibles on acquisitions charge reduced to £3.7m from £5.4m.
Acquisitions and Goodwill
In this period, the Group made six acquisitions of loan book assets along with the staff who TUPE across under such transactions. The total sum paid for these books was £5.7m, generating intangible assets and goodwill of £2.6m. This was a lower level of activity compared to last year when we paid £7.9m and generated intangible assets and goodwill of £2.8m.
In addition, we acquired the shares of Shelby Finance Limited in which an established online lending platform and associated credit decision infrastructure formed the primary asset.
The lower intangible amortisation for the year of £3.7m compared with £5.4m in the previous year arises from both the reduced level of acquisitions and lower amortisation of intangible assets from prior year acquisitions.
Dividend
Subject to Shareholder approval at the Annual General Meeting on 20 June 2017, the Board proposes to pay a final dividend of 4.3p per ordinary share payable on 21 July 2017 to all shareholders on the register at the close of business on 23 June 2017.
This payment is additional to the interim dividend of 2.1p per ordinary share already paid, making a total dividend for the year of 6.4p. The high dividend payment reflects the Board’s confidence in the business’ prospects and our commitment to provide a strong income yield to our Shareholders.
-
Strategic report CFO's operational and Financial Review
Balance Sheet
The total equity for the Group has increased from £55.4m at the end of last year to £61.4m. It should be noted that there is no final dividend accounted for in our first period as a listed company.
Net tangible assets, which exclude intangible assets arising on acquisitions, have increased by 14% to £54.4m from £47.8m at the end of last year.
Our main book asset is the net customer loan book which increased in value to £61.2m from £56.8m at the end of last year, an increase of 8%. Gross receivables from customers (before impairment provisioning, which includes discounting of cash flows) increased by 5% in the year. The higher growth in the net balance sheet value reflects the Group’s continued drive to improve loan book quality and thus reduce impairment provisions. This growth follows a period of contraction in the loan book since March 2014 while we upgraded the debt quality of our Shopacheck Financial Services business acquisition.
Funding
At the end of the financial year our debt stood at £10.0m, a marginal rise from the previous year’s £9.0m.
Christmas represents the Group’s peak borrowing period: in this financial year, borrowing reached £21.5m, compared with £20.0m in the previous year.
The Group currently has a £25m revolving debt facility with Shawbrook Bank PLC. It is secured by a debenture on our business assets and runs until March 2019, with a further term-out period until September 2019. The facility is subject to both financial and debt quality covenants which are typical of this form of lending. The Group has met these covenants historically and expects to do so for the duration of the facility.
Whilst this facility is sufficient to fund modest business growth and maintain a progressive dividend policy, the Directors are working to secure additional facilities in order to exploit any new business opportunities that arise. We would also like to build relationships with more than one lending institution.
The Board is keen to emphasise that any increase in gearing will always be firmly founded on our culture of Treating Customers Fairly.
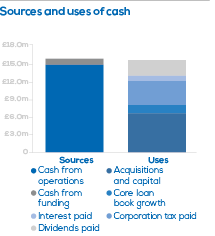
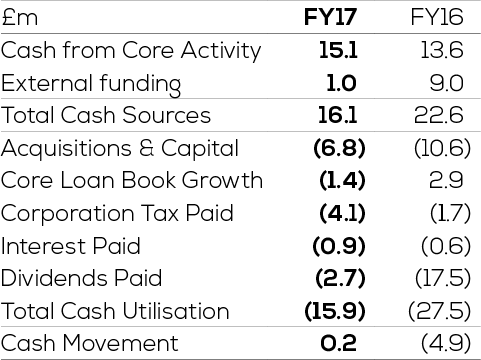
Cash Flow
Cash from core activities in the year generated £15.1m in cash (FY16: £13.6m), of which £6.8m (FY16: £10.6m) was invested in business acquisitions and capital expenditure.
The dividend payment in FY16 of £17.5m reflects many years of undistributed earnings as a private company.
A summary cash flow is shown below:
Andy Thomson
Chief Financial Officer
27 April 2017