Download centre
Strategic report
Governance
Financial statements
- Independent Auditor’s Report
- Consolidated Income Statement
- Balance Sheets
- Statement of Changes in Equity
- Cash Flow Statements
- Notes to the Consolidated Cash Flow Statement
- Notes to the Consolidated Financial Statements
- Morses Club PLC Information for Shareholders
Full Annual Report
 Annual Report 2017
Strategic reportInvestment Highlights and KPIs
Strategy and Performance
On flotation, we identified a number of investment highlights for investors.
Download section PDFBuilding a Market-leading UK Nonstandard Consumer Finance Company
- Long-established UK Home Collected Credit (HCC) market player with strong returns
- Proven track record of KPI-enhancing acquisitions and organic growth
- Prudent credit control and shorter duration loans improve both impairment and profitability
- Consolidation opportunities created by regulatory change
- Initiatives to future-proof the core business
- Highly invested IT platform
- Progressive dividend policy supported by strong cash generation
Our KPIs below comprise a set of performance metrics used by management to help gauge the meaningful progress of our business. The set is not exhaustive and management may also consider other measures when assessing performance.
-
 A profitability measure that deducts operating and non-operating expenses, but excludes the payment of tax and exceptional and non-recurring costs.
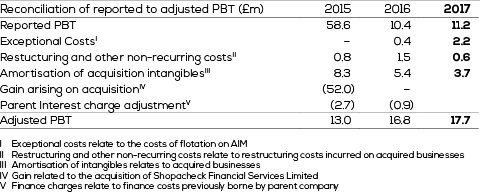
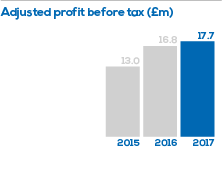
Adjusted profit before tax rose to £17.7m, an increase of 5%. Revenue growth of 10% was achieved whilst maintaining impairment comfortably within management’s guidance range and improving operating efficiencies.
A profitability measure that deducts operating and non-operating expenses, but excludes the payment of tax and exceptional and non-recurring costs.
Adjusted profit before tax rose to £17.7m, an increase of 5%. Revenue growth of 10% was achieved whilst maintaining impairment comfortably within management’s guidance range and improving operating efficiencies.
 A measure showing the profit before tax as reported in the Group’s statutory accounts.
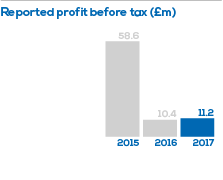
Reported profit before tax increased to £11.2m, an increase of 8%.
A measure showing the profit before tax as reported in the Group’s statutory accounts.
Reported profit before tax increased to £11.2m, an increase of 8%.
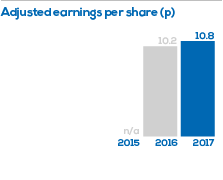 Total earnings divided by the weighted average number of shares, adjusted to remove impact of non-core activities and exceptional costs. Adjusted earnings per share of 10.8p and reported earnings per share of 6.6p reflect the strong profit contribution from our maiden year as a PLC, enabling the Group to pay the proposed final dividend of 4.3p (interim of 2.1p already paid). No relevant prior year comparatives are included for the period prior to listing. No relevant prior year comparatives are included for the period prior to listing.
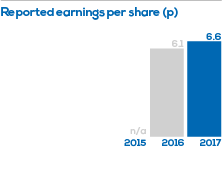
-
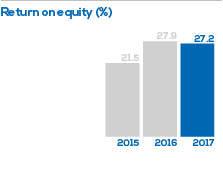 Adjusted earnings1 as a percentage of tangible equity value.
Return on equity of 27.2% demonstrates the strong returns within HCC and compares favourably with major competitors
Adjusted earnings1 as a percentage of tangible equity value.
Return on equity of 27.2% demonstrates the strong returns within HCC and compares favourably with major competitors
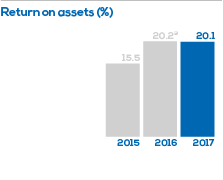 Adjusted earnings1 as a percentage of tangible assets.
Return on assets of 20.1% demonstrates the strong returns within HCC and compares favourably with major competitors.
Adjusted earnings1 as a percentage of tangible assets.
Return on assets of 20.1% demonstrates the strong returns within HCC and compares favourably with major competitors.
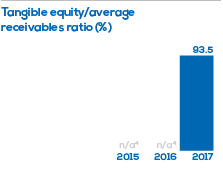 Tangible equity value at period end as a percentage of average net receivables over the period.
This ratio demonstrates the Group’s ability to generate return with very little external debt.
Tangible equity value at period end as a percentage of average net receivables over the period.
This ratio demonstrates the Group’s ability to generate return with very little external debt.
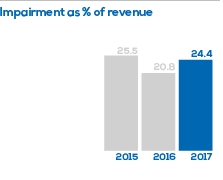 The value of impairment charged as a cost to the income statement as a percentage of revenue.
The impairment:revenue ratio remains comfortably within management’s guidance range of 22–27%.
The value of impairment charged as a cost to the income statement as a percentage of revenue.
The impairment:revenue ratio remains comfortably within management’s guidance range of 22–27%.
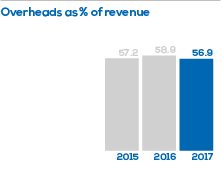 The direct expenses of running the business as a percentage of revenue (including agents’ commission).
The cost income ratio fell from 58.9% to 56.9% in the period as management continues to leverage operational efficiencies from its investment in technology.
The direct expenses of running the business as a percentage of revenue (including agents’ commission).
The cost income ratio fell from 58.9% to 56.9% in the period as management continues to leverage operational efficiencies from its investment in technology.
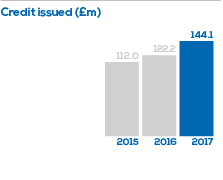 Aggregate value of loans issued over the period.
Sales demand was strong, especially in H2. We achieved annual growth of c.18% from core and acquisition sources.
Aggregate value of loans issued over the period.
Sales demand was strong, especially in H2. We achieved annual growth of c.18% from core and acquisition sources.
-
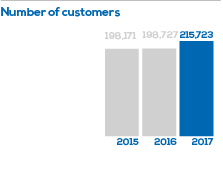 Total number of customers at period end.
Customer numbers grew by 9% through a combination of organic means and acquisition activity. During the year the Group introduced its own pre-paid Visa debit card, aimed at a younger demographic. By February 2017, around 6,500 customers had a Morses Club Card.
Total number of customers at period end.
Customer numbers grew by 9% through a combination of organic means and acquisition activity. During the year the Group introduced its own pre-paid Visa debit card, aimed at a younger demographic. By February 2017, around 6,500 customers had a Morses Club Card.
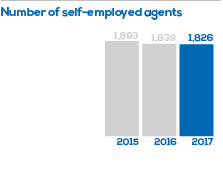 Total number of self-employed agents at period end.
Management has focused on reducing vacancy rates and optimising territory sizes during the year, rather than increasing absolute agency numbers.
1. As described in earnings per share ratio.
Total number of self-employed agents at period end.
Management has focused on reducing vacancy rates and optimising territory sizes during the year, rather than increasing absolute agency numbers.
1. As described in earnings per share ratio.
2. Net assets less intangible assets excluding capitalised software.
3. Total assets less intangible assets excluding capitalised software.
4. 2015 comparatives not available due to IFRS conversion.