


 45 / 72

Long-term Equity Incentive (LTI) Award
A summary of the determination of the size and final realized LTI award for the CEO and President is shown below, with
further details provided in the narrative following the illustration:
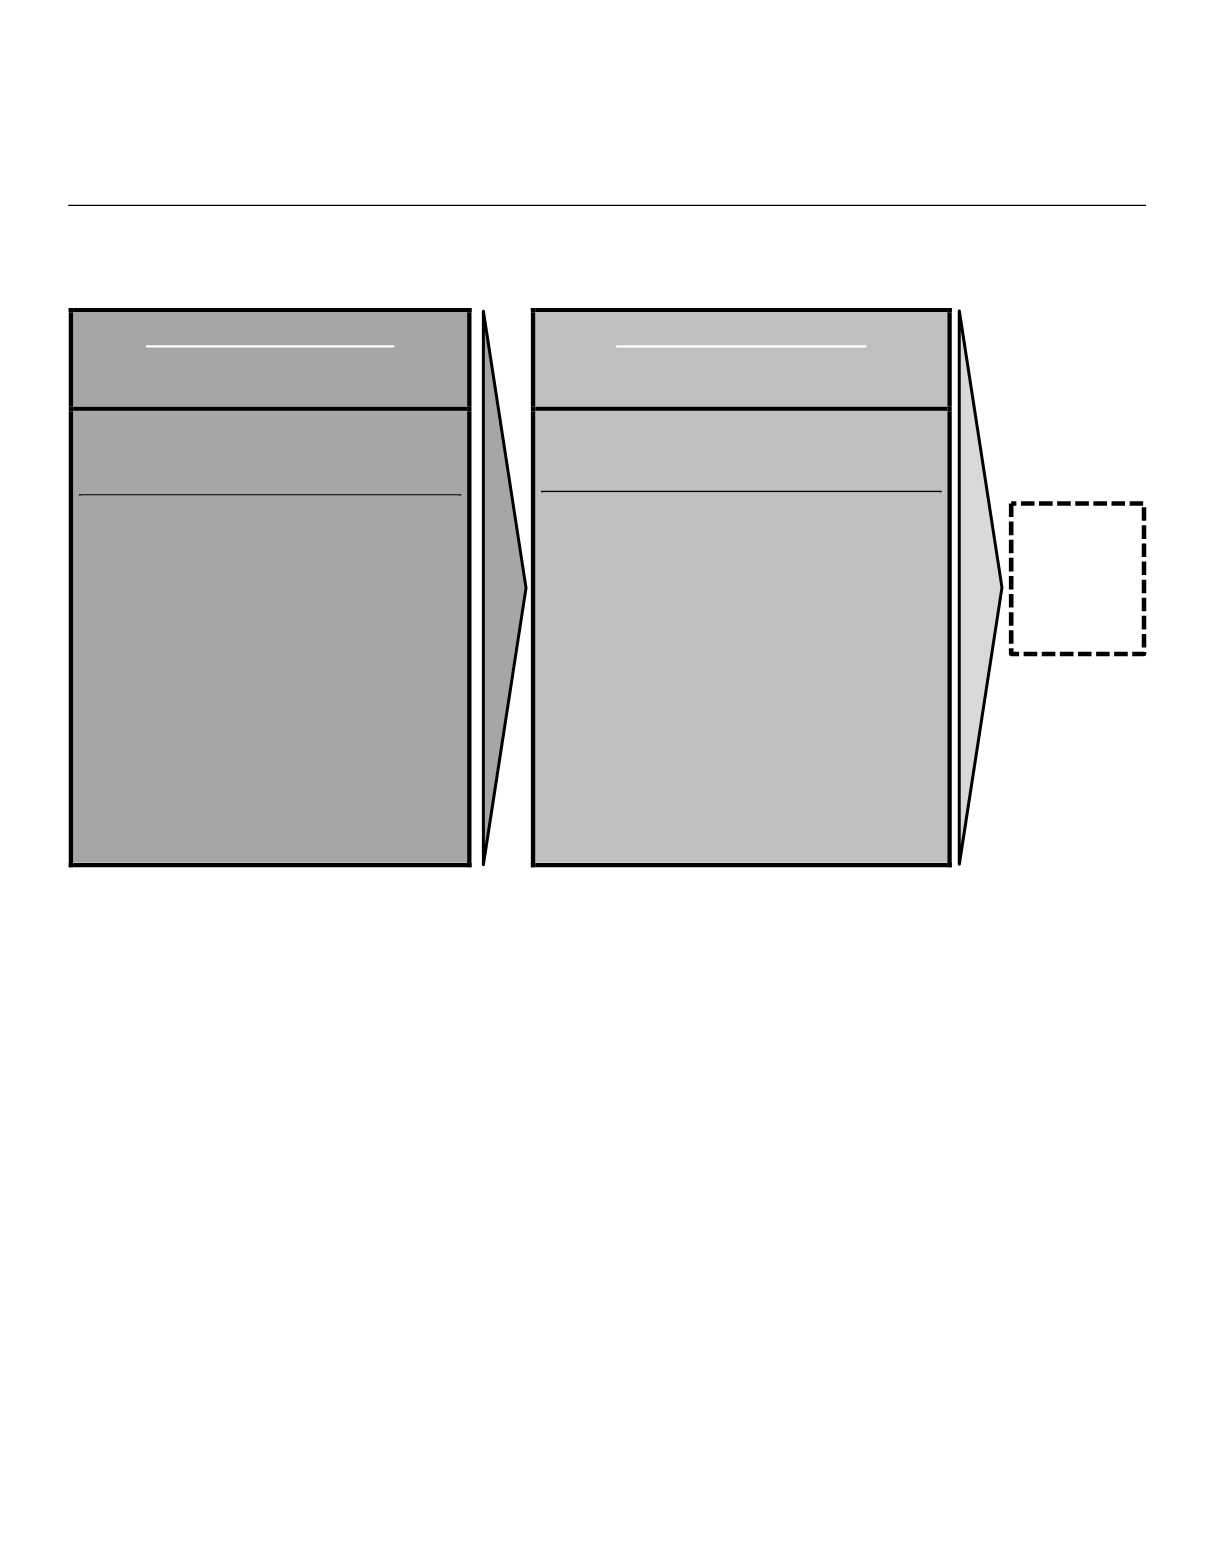
1
ST
PERFORMANCE TEST
Determines Maximum LTI Award
(There is NO Targeted LTI Award)
2
ND
PERFORMANCE TEST
Determines Ultimate Value of LTI Award
at End of Vesting Period
PBRS grant amount is determined
based on Aflac Incorporated’s relative
financial and TSR performance
Relative financial performance
(weighted 54%) is measured by:
Revenue growth
Net income growth
Premium income growth
EPS growth
Return on revenues
Return on average equity
Return on average assets
Relative TSR performance (weighted
46%) is measured by:
1-year TSR
3-year TSR
PBRS award value is determined by
achievement of our core capital adequacy
ratio over a three-year period
Performance is measured by RBC:
Measures capital adequacy by
quantifying insurance risk,
business risk, and interest rate
risk of the consolidated
insurance operations of Aflac
Japan and Aflac U.S.
Similar to the PBRS awards granted to our other NEOs,
the CEO’s and President’s 2015 LTI awards were made
in 100% PBRS contingent upon the Company’s RBC
performance over the three-year period spanning 2015
to 2017. The RBC metric selected for the PBRS awards
to the CEO and President is the same as that disclosed
previously in the section titled
“
Long-term Equity
Incentives” beginning on page 35.
Consistent with prior years, the size of the CEO’s 2015
LTI award was based upon the Company’s relative
performance against its peers across the metrics shown
in the following table. Relative financial performance
carries an overall weighting of 54% and is measured by
revenue growth, net income growth, premium income
growth, earnings per share (“EPS”) growth, return on
revenues, return on average equity, and return on
average assets. Relative total shareholder return
(“TSR”) performance carries an overall 46% weighting
and is measured by 1-year TSR and 3-year TSR. The
performance period for all non-TSR metrics was the
trailing twelve month period ending September 30,
2015; and for the two TSR metrics, the Company’s TSR
was compared against the peers as of December 31,
2015. As summarized below, the contingent grant to
the CEO and President in February 2015 was trued-up
on December 31, 2015. This program design helps
align the LTI award for the CEO and President with our
relative performance for the current year (i.e., 2015).
As mentioned previously, the President was placed on
a performance-based program similar to the CEO’s
starting in 2015.
Based upon an analysis of the Company’s relative
financial performance and TSR, the Company ranked
10 out of 18 companies (17 peers plus the Company);
the lower the total weighted composite score, the higher
a company’s overall ranking (rankings on each metric
are out of 18 companies):
Realized
Value of
PBRS
Award
38