


 46 / 72

2015 Financial Performance Ranking Matrix
Aflac Incorporated Relative Ranking Among Peer Group
Aflac
Incorporated
Revenue
1-Year
Growth
Net
Income
1-Year
Growth
Premium
Income
1-Year
Growth
EPS
1-Year
Growth
Return on
Revenues
2015
Return on
Average
Equity
2015
Return on
Average
Assets
2015
1Yr
Indexed
TSR
(12/31/14-
12/31/15)
3Yr
Indexed
TSR
(12/31/12-
12/31/15)
Composite
Score
Performance
Rank
Relative
Ranking
(out of 18
companies)
12
12
13
12
3
3
8
10
17
—
—
Weightings
1
1
1
1
2
2
2
4
4
—
—
Totals
12
12
13
12
6
6
16
40
68
185
10
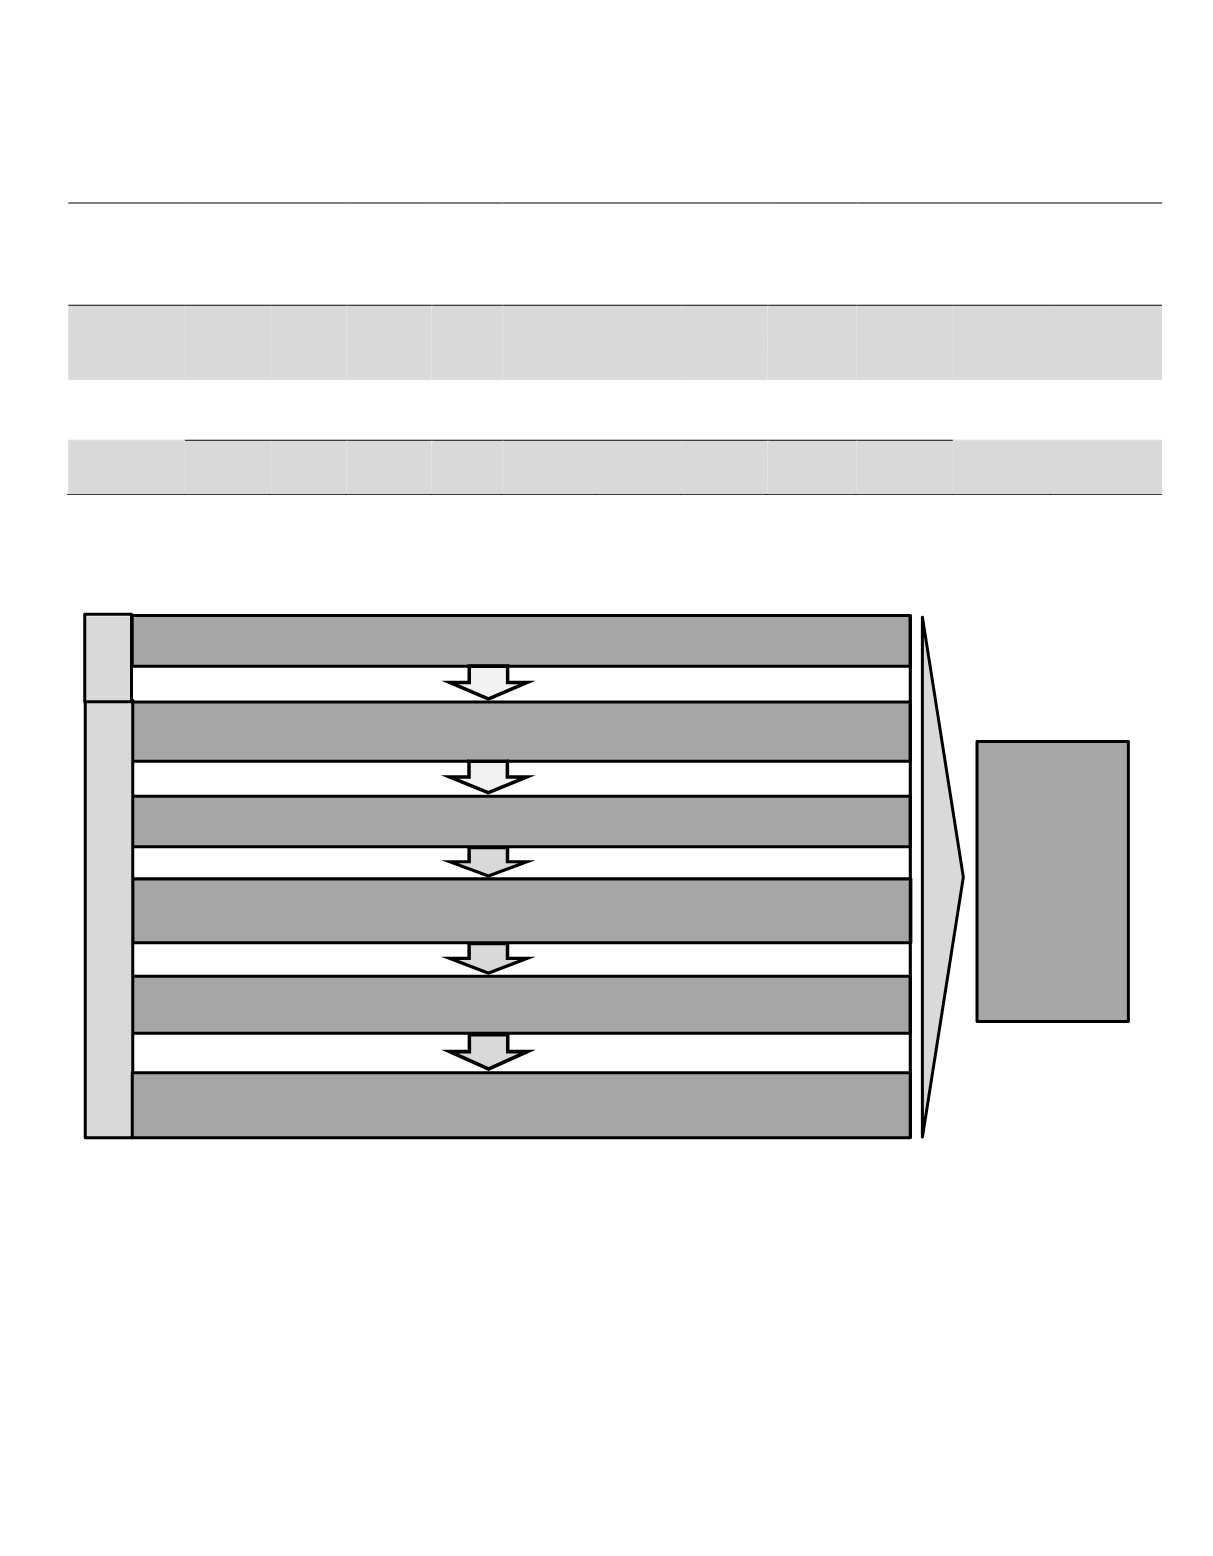
The CEO’s and President’s PBRS grant processes are summarized below:
For 2015, the above-described process resulted in the CEO receiving 78,548 PBRS, and the President receiving 49,101
PBRS. See “2015 Grants of Plan-based Awards” table for additional information.
Step 2: Determine the Company’s relative financial and TSR performance against its peers
Step 3: Assess CEO TDC at peers
Step 4: Calculate TDC amount for the CEO based upon the Company’s performance
percentile ranking versus peers
Step 5: Determine CEO’s final PBRS grant based on prior steps—adjust contingent PBRS
grant from February to reflect actual relative performance ranking
December
ecember
Step 1: Contingent PBRS grant issued based on prior year’s performance
February
Grant
received
contingent on
performance
over next
three years;
thus, CEO and
President
have to earn
award twice
Step 6: Determine President’s final PBRS grant—adjust contingent PBRS grant from
February so that TDC equates to 55% of CEO’s TDC
39