


 41 / 72

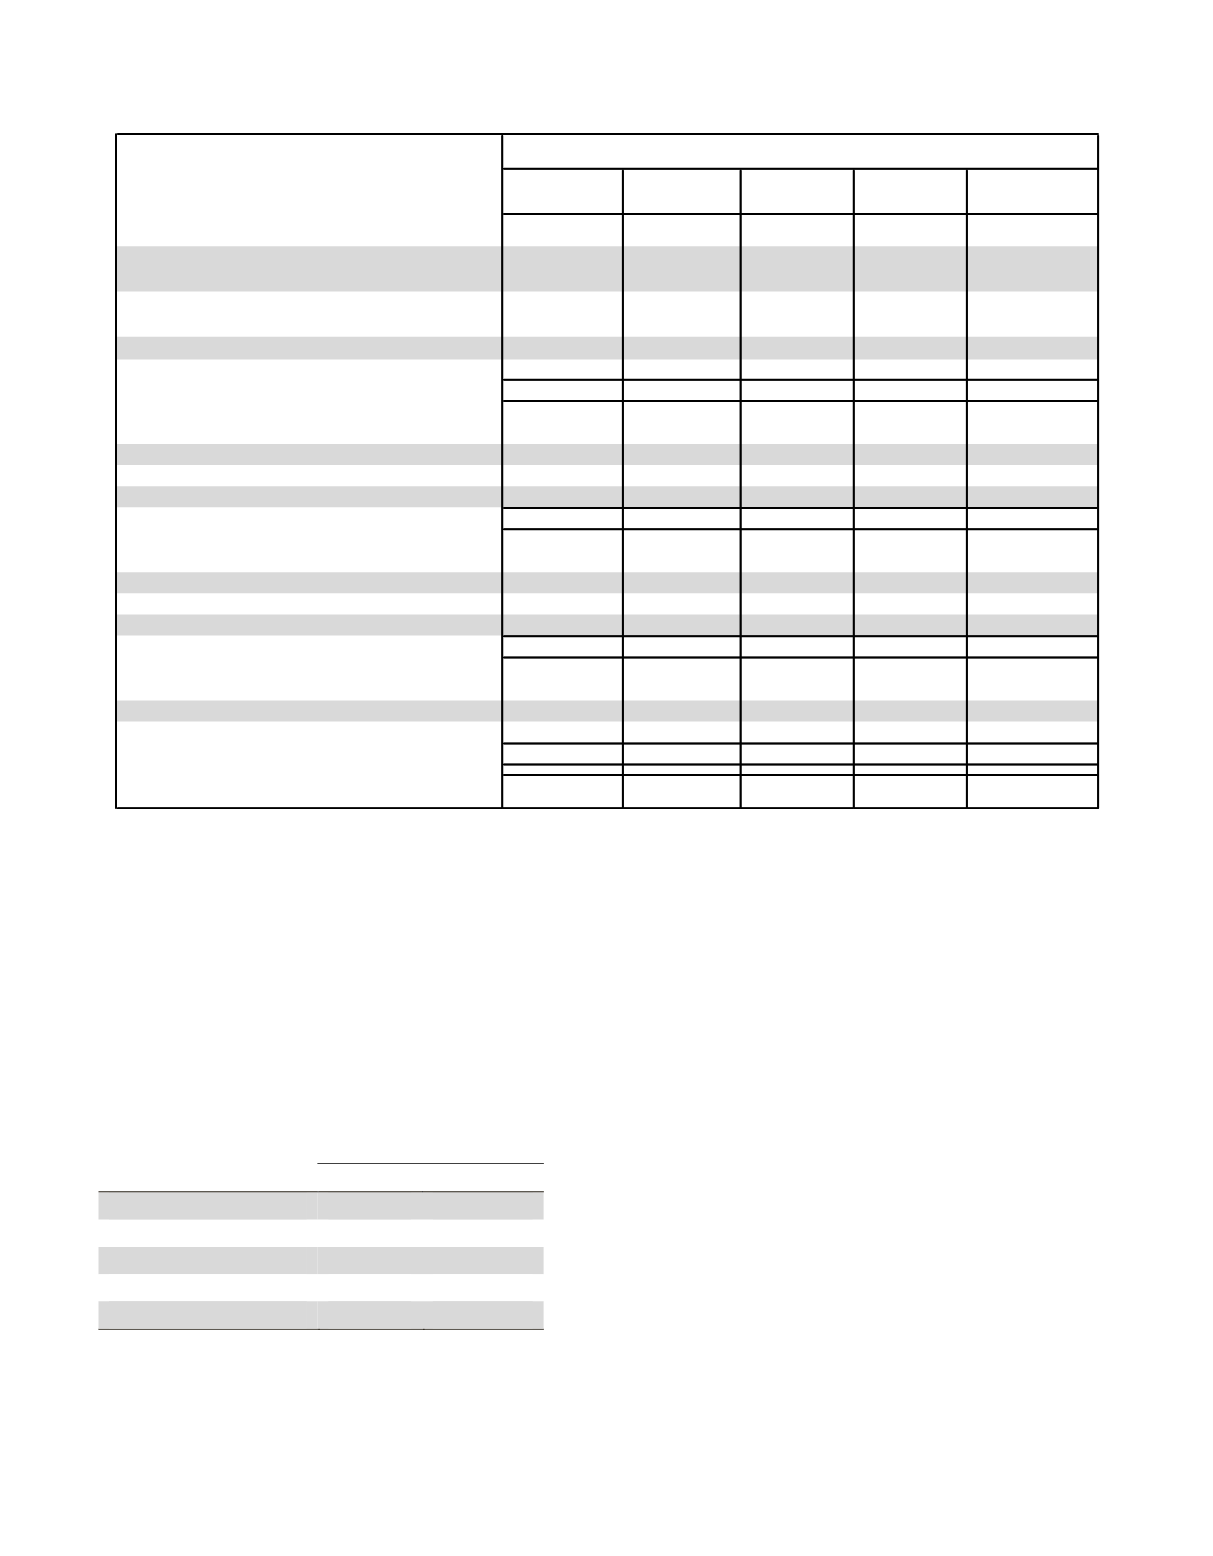
Weightings of Each Performance Objective for 2015:
The performance measures are weighted for the NEOs
and all other officer levels of the Company. The intent
is to weight them according to how each position can
and should influence their outcome.
Actual performance relative to MIP targets was
determined after the end of the year and presented to
the Compensation Committee for discussion and
approval at its February 2016 meetings.
2015 MIP Payouts:
The following table reflects target, earned and paid
percentages of salary for the non-equity incentive
measures based on 2015 performance results for the
NEOs:
Percent of Base
Salary
NEO
Target
Earned
Daniel P. Amos
220%
382%
Frederick J. Crawford
125%
222%
Kriss Cloninger III
150%
265%
Paul S. Amos II
125%
239%
Eric M. Kirsch
200%
381%
The Compensation Committee has the discretion in
certain limited circumstances to adjust the MIP results
related to performance measures if it deems that a
class of MIP participants would be unduly penalized or
rewarded due to the incomparability of the result to the
performance measure as determined by the
Compensation Committee. The Compensation
Committee did not adjust the NEOs’ MIP results for
2015.
For additional information about the MIP, please refer to
the 2015 Grants of Plan-Based Awards table below,
which shows the threshold, target, and maximum award
amounts payable under the MIP for 2015, and the 2015
Summary Compensation Table, which shows the actual
amount of non-equity incentive plan compensation paid
to the NEOs for 2015.
Daniel P.
Amos
Frederick J.
Crawford
Kriss
Cloninger III
Paul S.
Amos II
Eric M. Kirsch
Corporate Objectives:
Operating Earnings per share (excluding foreign
currency effect)
22.73% 24.00% 22.67% 24.00%
20.00%
Operating Return on Shareholder Equity (excluding
foreign currency effect)
11.36% 8.80% 9.33% 8.00%
10.00%
Solvency Margin Ratio
11.36% 8.80% 9.33% 8.00%
7.50%
Net Investment Income (Consolidated)
9.10% 8.00% 8.67% 8.00%
—
Subtotal Aflac Inc.
54.55% 49.60% 50.00% 48.00%
37.50%
U.S. Segment:
New Annualized Premium
6.81% 5.20% 5.33%
—
—
Direct Premiums
4.55% 5.20% 5.33%
—
—
Pretax Operating Earnings
4.55% 5.60% 6.01% 8.00%
—
Subtotal
15.91% 16.00% 16.67% 8.00%
—
Japan Segment:
New Annualized Premium
11.36% 10.40% 10.00% 16.00%
—
Direct Premiums
9.09% 10.40% 10.00% 8.00%
—
Pretax Operating Earnings
9.09% 13.60% 13.33% 20.00%
—
Subtotal
29.54% 34.40% 33.33% 44.00%
—
Global Investments:
Net Investment Income (Consolidated)
—
—
—
—
45.00%
Credit Losses/Impairments
—
—
—
—
17.50%
Subtotal
—
—
—
—
62.50%
GRAND TOTAL
100.00% 100.00% 100.00% 100.00% 100.00%
Weightings of Annual Incentive Metrics as a Percent of Target
34