125
Annual Report and Accounts 2014
4.5.2
The IMI Pension Funds (now ‘The UK Funds’)
The United Kingdom constitutes 84% of Group defined benefit liabilities and
90% of Group defined benefit assets. Historically ‘the UK Funds’ offered final
salary benefits to UK employees until it closed to new entrants in 2005 and to
future accrual on 31 December 2010. The UK Trustee Board and the Company
have continued a gradual programme of de-risking activities. Recently this
has included:
In 2013 the Group increased its inflation hedging and reduced the investment
in higher risk assets to reduce the funding volatility. In 2014 £70m cash was
injected following the disposal of the Retail Dispense businesses, £53.2m of
which was paid in January 2014 which enabled the Trustee to remove
all exposure to public equities:
In December 2014, winding-up procedures commenced, with over 2,500
members accepting either trivial commutation payments or winding-up lump
sums as full settlement of their Fund pension. The total of the lump sum
payments was £25.2m and led to a £3.5m settlement gain. Those members
who were not eligible or did not take up the offer of a single cash lump sum
transferred to one of two new Funds (IMI 2014 Pensioner Fund or the IMI 2014
Deferred Fund). Both Funds will continue to be run by the same Trustee Board
as the IMI Pension Fund with assets held via the IMI Common Investment Fund.
The UK Trustee has determined an investment objective to achieve, over time,
a position of self-sufficiency, defined using a discount rate of gilts + 0.25%.
The last full actuarial valuation was undertaken as at 31 March 2014 and the six
year recovery plan agreed with the Company as a result of the 2011 Valuation
was re-ratified, with payments of £16.8m being paid each July until 2016.
Contributions paid or to be paid into the Group’s UK Funds since 2011,
are shown in the table below, split between the six year recovery plan and
additional contributions.
Recovery
Additional
plan
amounts
Total
£m
£m
£m
2011
16.8
36.1
52.9
2012
16.8
-
16.8
2013
16.8
16.8
33.6
2014
16.8
53.2
70.0
2015
16.8
-
16.8
2016
16.8
-
16.8
Total
100.8
106.1
206.9
The two new UK Funds will have actuarial valuations as at 31 March 2015
which, on completion, will lead to two new recovery plans (if required). As at
31 December 2014 the two UK Funds were, in total, 64% (2013: 54%) hedged
against interest rates and 70% (2013: 48%) hedged against UK inflation on
the Trustee’s self-sufficiency basis.
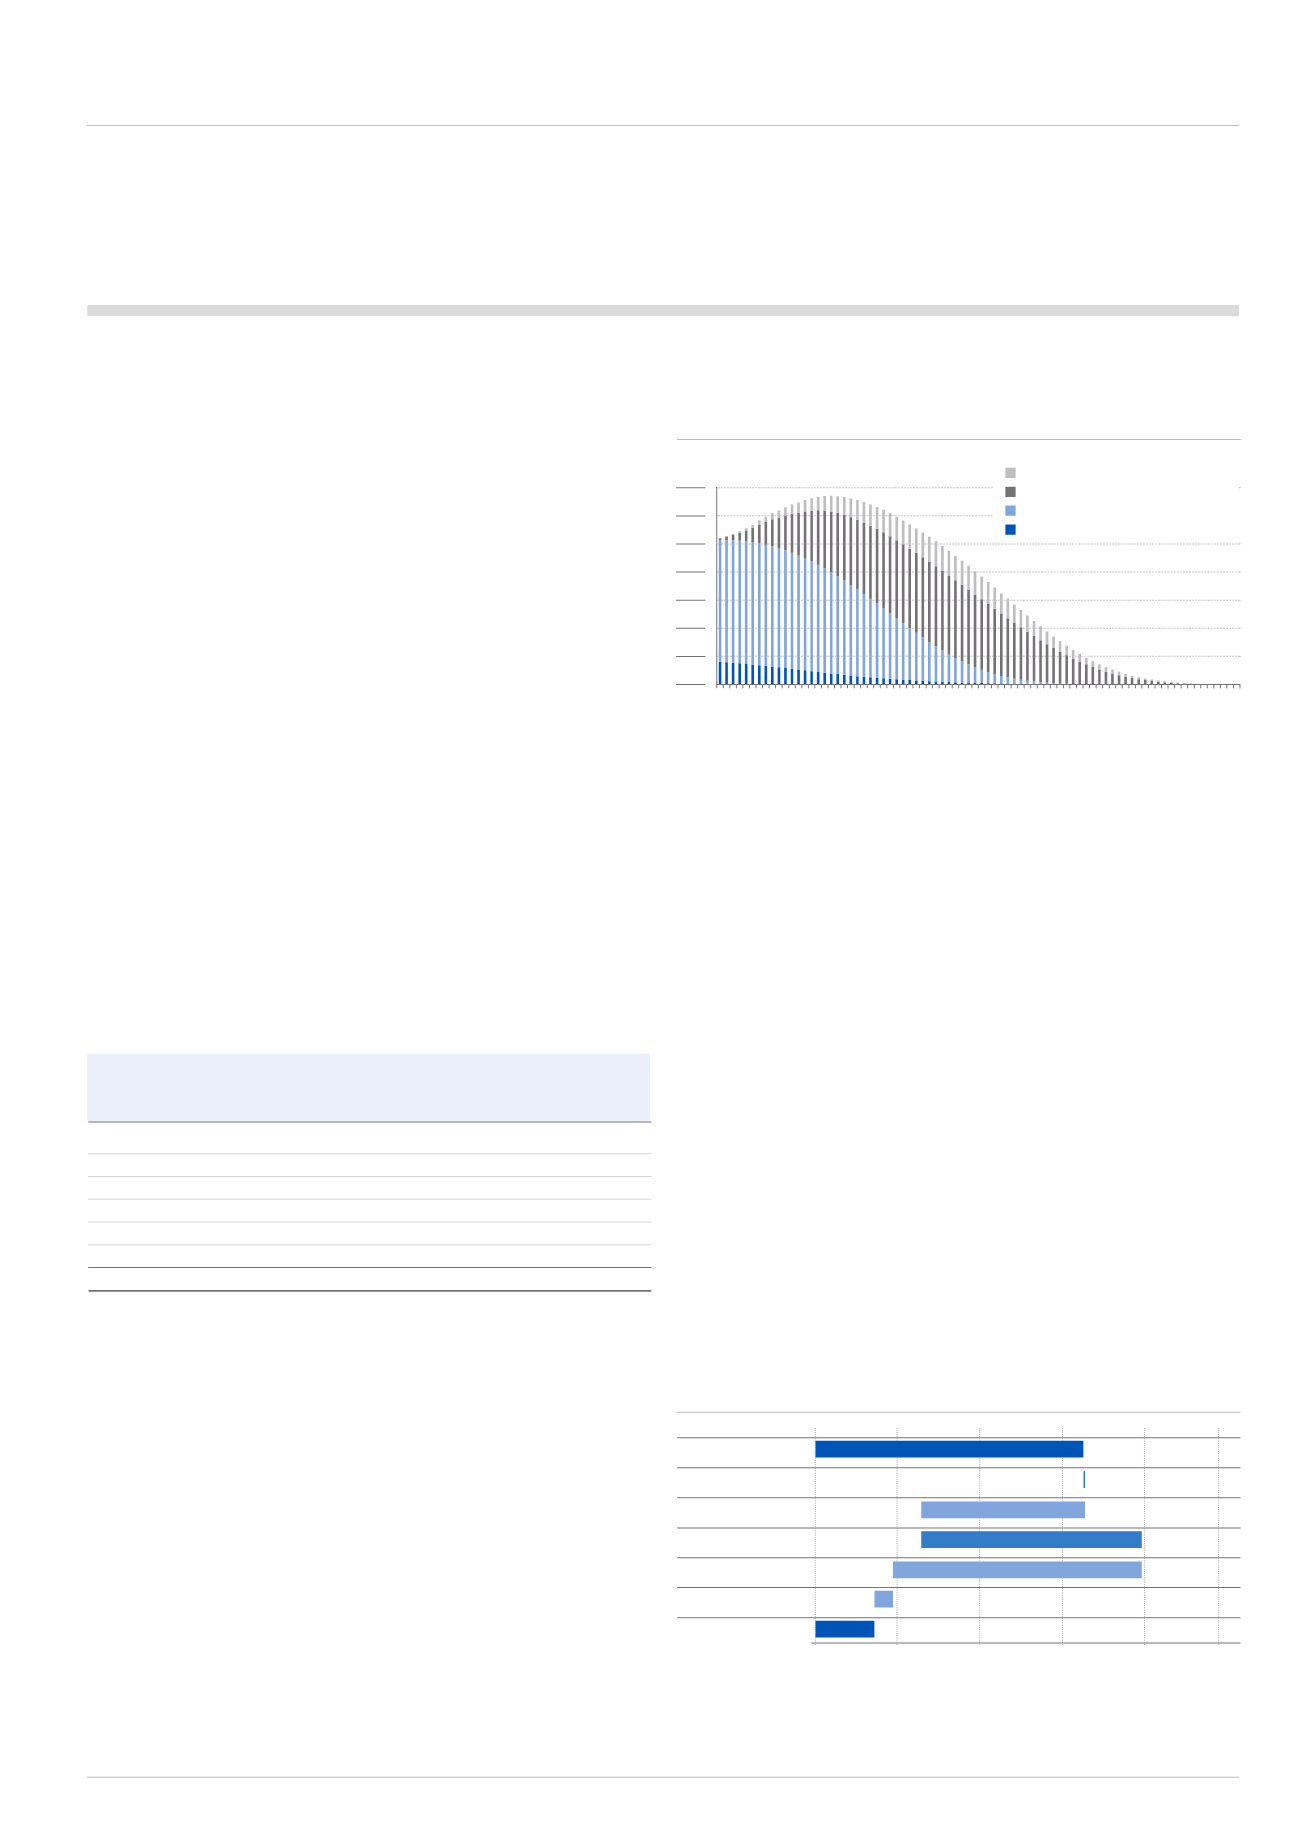
The following chart shows the projected liability cash flows by year of the
Group’s UK defined benefit liabilities:
4.5.3
Specific effect on financial statements
The corresponding entries for increases and decreases in the net pension
deficit reported in the balance sheet are reflected as follows:
•
Cash flow statement:
When the Group makes cash contributions to
fund the deficit they are reflected in the cash flow statement and reduce
the net deficit.
•
Other comprehensive income (‘OCI’):
Movements in the overall net
pension deficit are recognised through OCI when they relate to changes in
actuarial assumptions or the difference (‘experience gain or loss’) between
previous assumptions and actual results.
•
Income statement:
Movements in the overall net pension deficit are
recognised in the income statement when they relate to changes in the
overall pension promise, due to either an additional period of service (known
as ‘current service cost’), changes to pension terms in the scheme rules
(known as ‘past service cost’), or closure of all or part of a scheme (known as
settlements and curtailments). The interest charge/income on the net deficit/
surplus position is also recognised in the income statement.
The following chart shows how the movements in the total net defined benefit
obligation in the balance sheet in the year were reflected in the financial
statements. As discussed earlier in this report, the comparative assets and
liabilities associated with the Retail Dispense businesses were separately
reported as assets or liabilities held for sale.
Net IAS19 Pension Deficit £m
As at 31.12.14
Other movements
OCI - Asset Returns
OCI - Assumptions
Contributions
Service Cost & Interest
As at 01.1.14
0.0
50.0
100.0
150.0
200.0
250.0
157.9
0.9
96.6
130.0
146.6
10.9
34.7
Current pensioners
Current dependents
Current preserved employed members
Current deferred pensioners
Split by membership type
20
10
30
40
50
60
£ millions
Year
1 APR 2014
MAY 2014
JUN 2014
JUL 2014
AUG 2014
SEP 2014
OCT 2014
NOV 2014
DEC 2014
JAN 2015
FEB 2015
MAR 2015
31 MAR 2015
70


