124
IMI plc
SECTION 4 – CAPITAL STRUCTURE AND FINANCING COSTS
Continued
The table below reconciles the movement in the UK and overseas defined
benefit obligation between 1 January 2014 and 31 December 2014.
UK Overseas
Total
£m
£m
£m
Net Defined Benefit Obligation
at 1 January 2014
(63.1)
(94.8)
(157.9)
Movement recognised in:
Income statement
3.4
(4.3)
(0.9)
Other comprehensive income
49.8
(29.4)
20.4
Cash flow statement
70.0
26.6
96.6
Disposals
-
7.1
7.1
Net Defined Benefit Surplus/
(Obligation) at 31 December 2014
60.1
(94.8)
(34.7)
Asset profile of schemes
The following table sets out the profile of the overall assets of the schemes
(to give an indication of their risk profile), the comparative amounts of the funded
and unfunded DBO and a split of the balance sheet impact between schemes
with a net pension surplus and a net pension deficit. As noted later in this section,
further de-risking was undertaken in January 2014, following the payment into the
UK Funds from the proceeds of the sale of the Retail Dispense businesses.
2014
2013
£m
£m
Quoted equities
22.9
32.0
Quoted bonds
703.1
558.4
Total quoted assets
726.0
590.4
Private equities
85.0
69.8
Insurance policies
287.9
286.6
IMI Scottish Limited Partnership
15.1
13.0
Hedge Funds
185.4
169.0
Property
34.8
40.1
Private finance initiatives
76.8
71.7
Other*
64.8
53.0
Total unquoted assets
749.8
703.2
Fair value of assets
1,475.8
1,293.6
Restriction due to asset ceiling
(0.1)
(0.3)
DBOs for funded schemes
(1,445.0)
(1,373.0)
DBOs for unfunded schemes
(65.4)
(79.0)
Included in liabilities held for sale
-
0.8
Net liability for DBOs
(34.7)
(157.9)
Schemes in net pension deficit
(94.9)
(158.2)
Schemes in net pension surplus
60.2
0.3
* ‘Other’ assets include the market value of interest, inflation, equity and
currency swaps relating to UK scheme assets and liabilities.
The overseas assets of £152.1m (2013: £147.1m) comprise equities of
£22.9m (2013: £32.0m), bonds of £88.7m (2013: £70.3m), property of
£9.5m (2013: £9.4m) and other assets of £31.0m (2013: £35.4m).
Funded:
The majority of the Group defined benefit and other post-employment
benefit arrangements are funded, which means they are linked to specific plan
assets that have been segregated in a trust or foundation.
Unfunded:
Plans that are not funded are those that are not backed by
segregated assets. These include some pension plans but also a number of other
long-term arrangements for the benefit of our employees, with benefits payable
while they are employed by the Group but more than 12 months after the related
service is rendered. Actuarial gains and losses on other long-term arrangements
are recognised in the income statement in the period in which they arise.
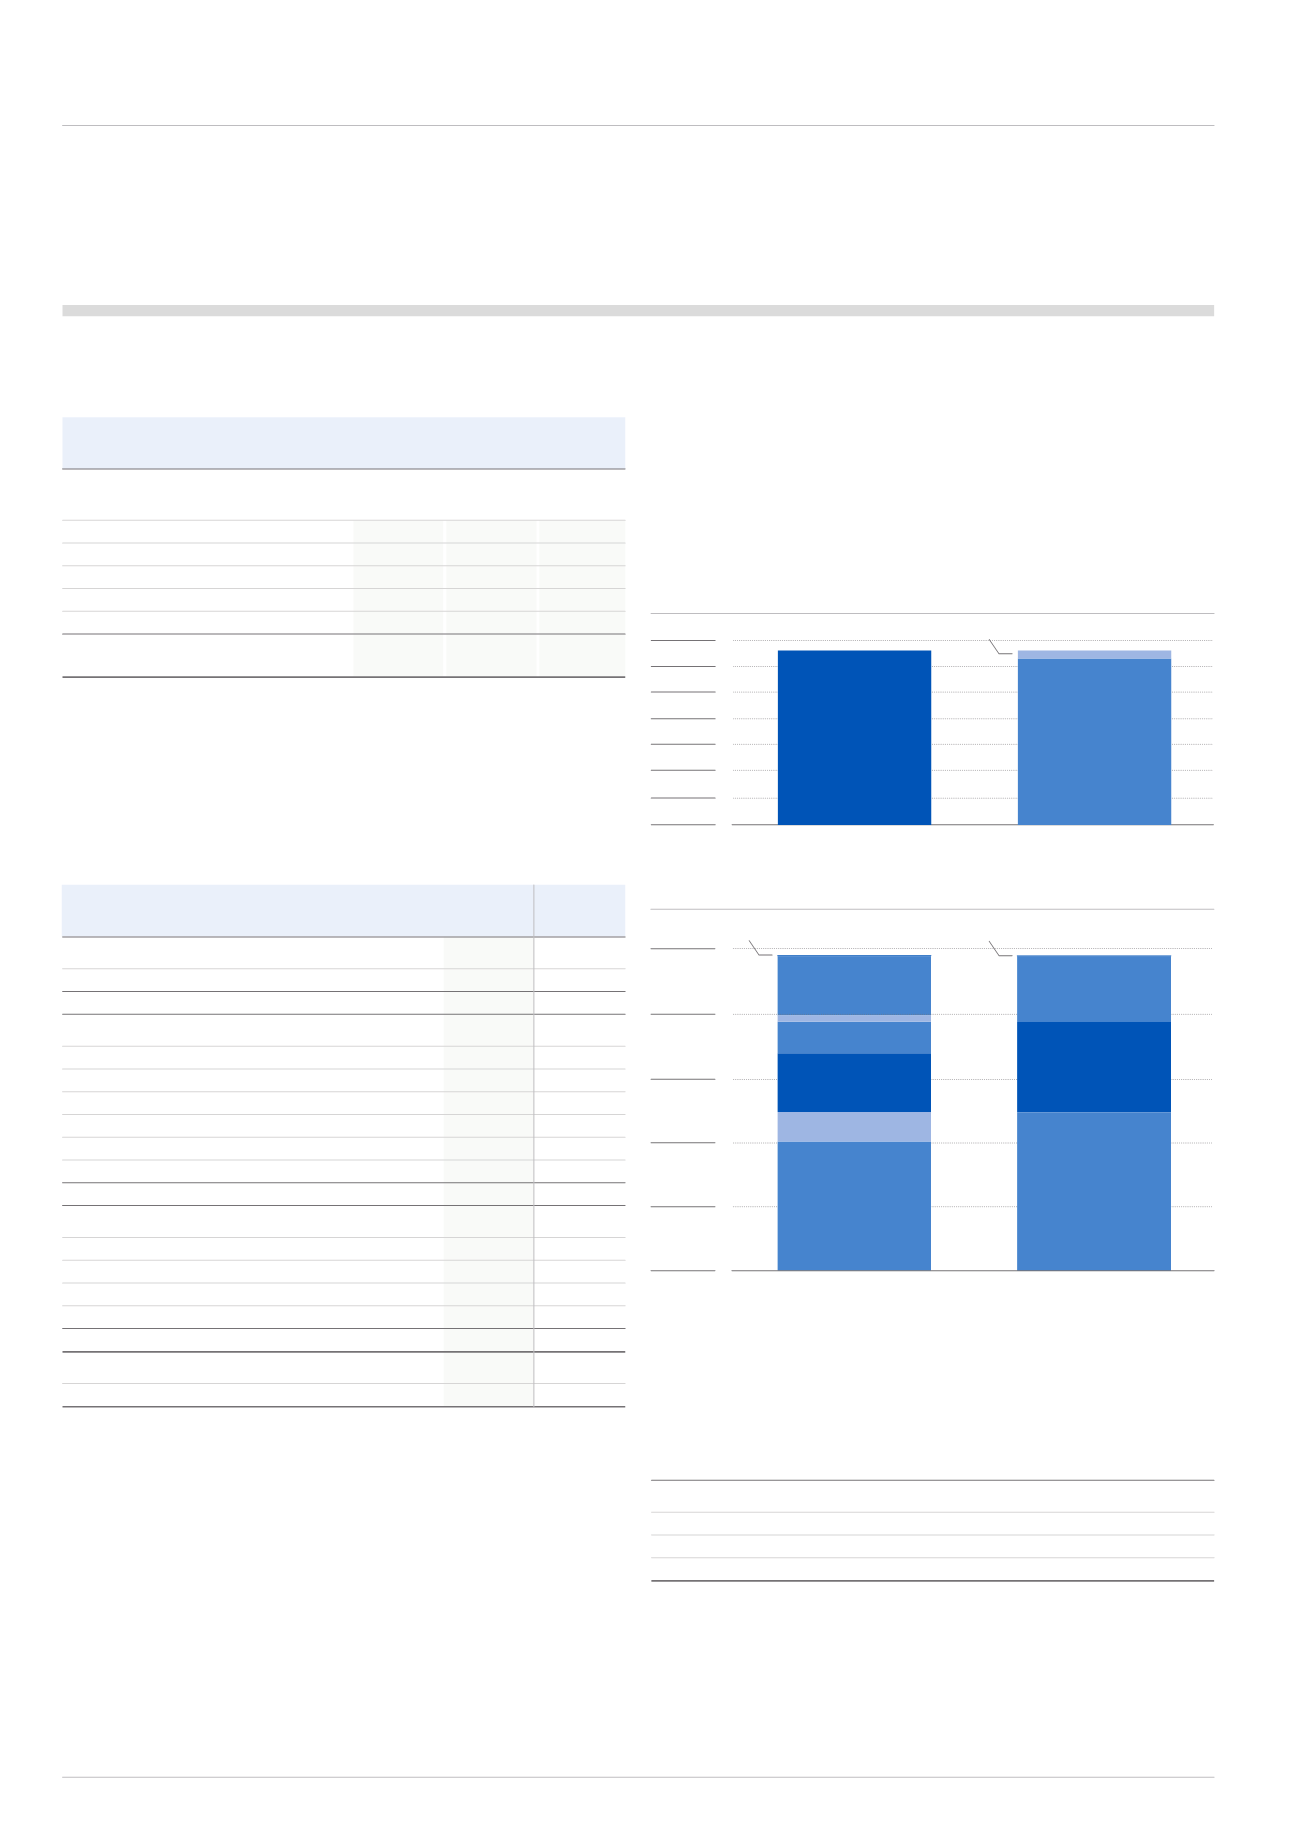
Regional split of defined benefit obligation
The following charts show the geographical profile of the total defined
benefit obligations:
UK pension assets & liabilities
Overseas pension assets & liabilities
The USA deficit above excludes £18.9m of assets relating to unqualified plans
classified as investments (see section 4.4.6).
Average Duration by geography
The following table shows the weighted average number of years (or duration)
over which pension benefits are expected to be paid:
Location
Years
UK
15.7
Switzerland
14.4
USA
14.1
Eurozone
15.4
Assets
Liabilities
£200.0
£400.0
£600.0
£800.0
£1,000.0
£1,200.0
£1,400.0
UK - £1,323.8m
UK - £1,263.7m
£50.0
£100.0
£150.0
£200.0
£250.0
Assets
Liabilities
USA - £46.0m
USA - £70.5m
USA Deficit - £24.5m
Switzerland - £101.0m
Switzerland - £124.2m
Eurozone - £5.0m
Switzerland Deficit - £23.2m
Eurozone - £51.4m
Other Deficit - £0.7m
Other - £0.7m
UK Surplus £60.1m
Eurozone Deficit - £46.4m


