96
IMI plc
The following table shows a geographical analysis of the location of the Group’s property, plant and equipment and intangible assets (‘PPE&IA’) and assets held
for sale (‘AHFS’).
Total
PPE&IA
AHFS
Total
2014
2013
2013
2013
£m
£m
£m
£m
UK
77.0
69.7
41.9
111.6
Germany
130.9
147.0
3.3
150.3
Rest of Europe
208.2
254.1
1.0
255.1
USA
123.6
114.2
89.3
203.5
Asia Pacific
35.4
32.4
3.2
35.6
Rest of World
19.1
35.9
0.5
36.4
Total
594.2
653.3
139.2
792.5
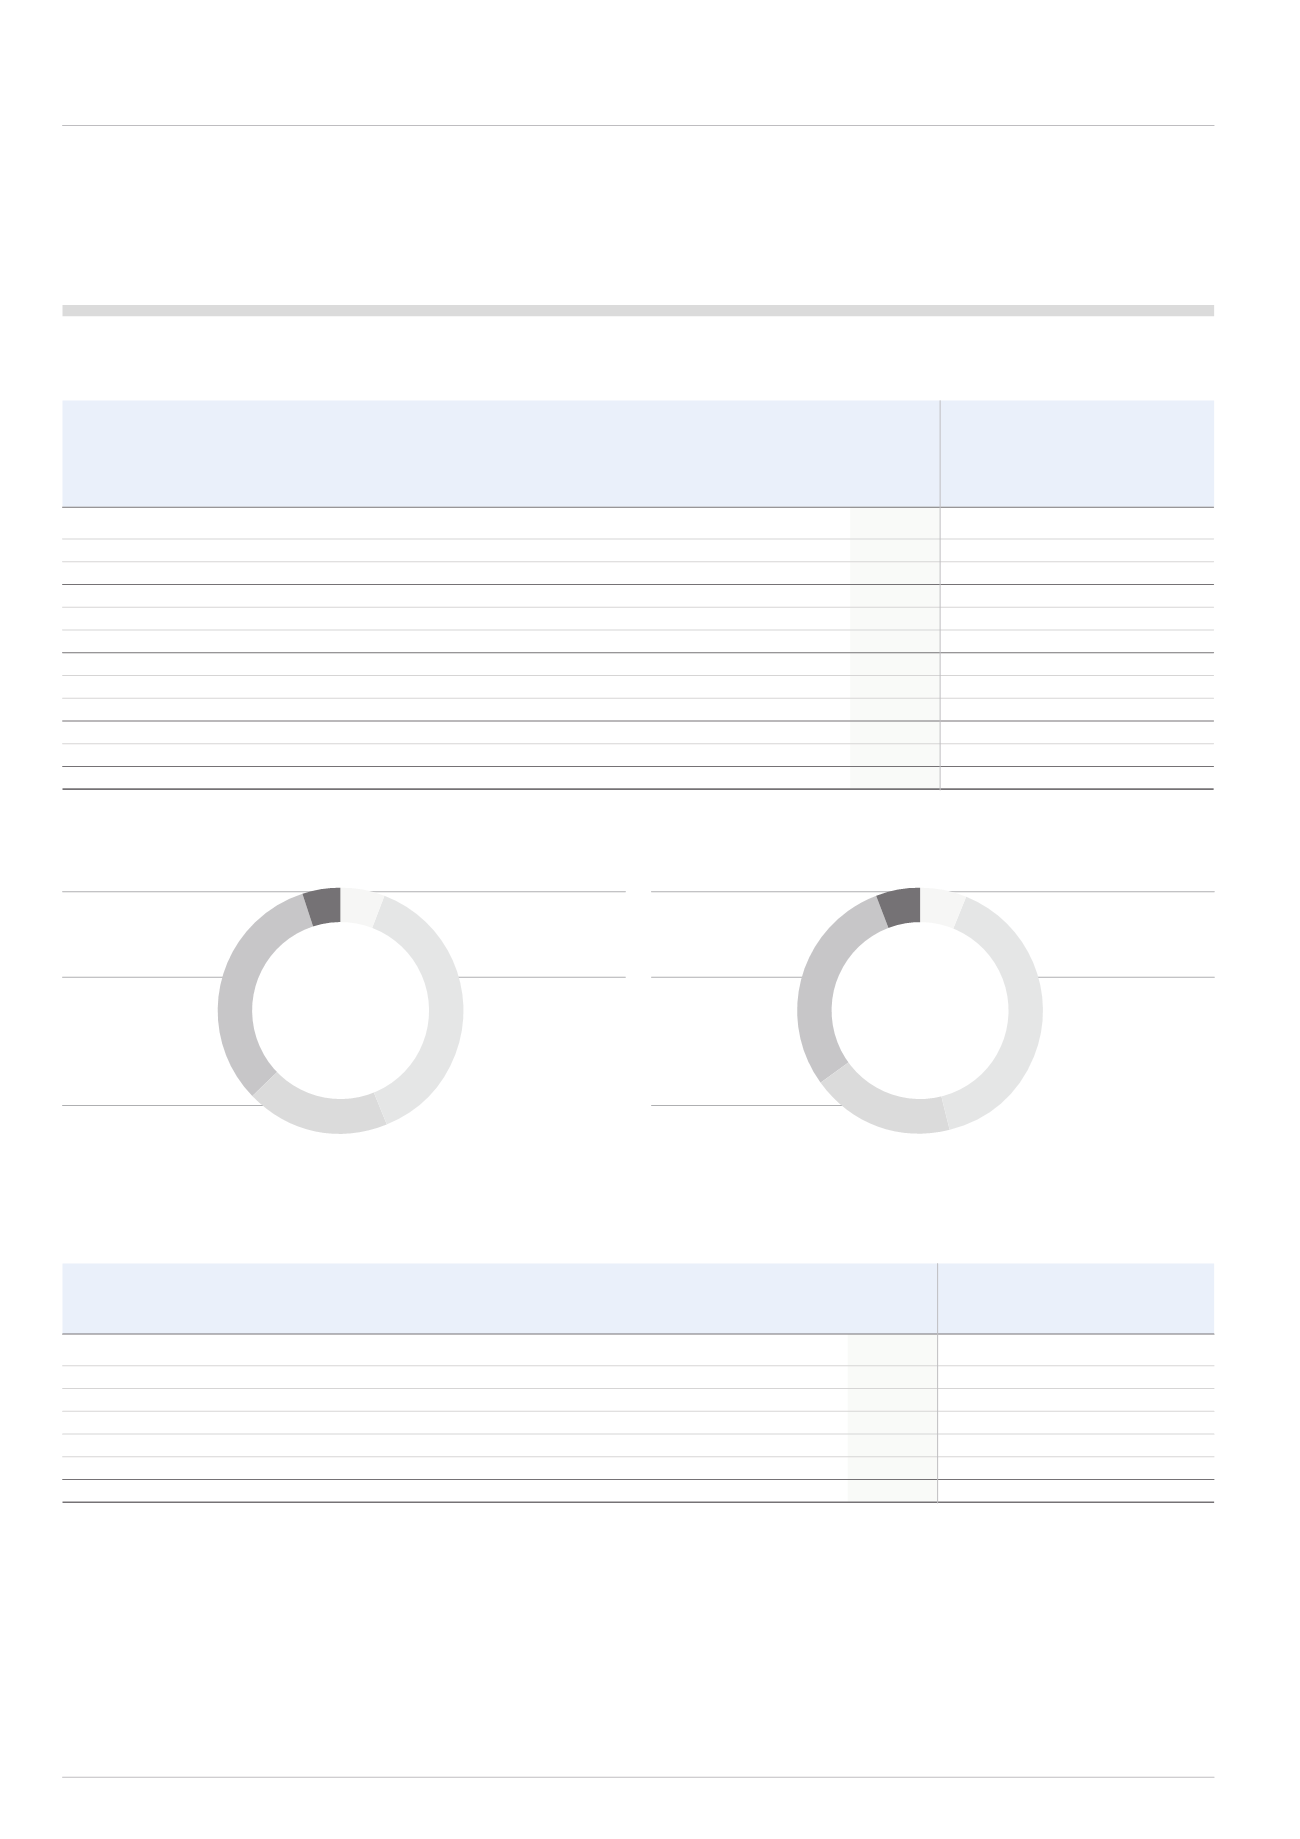
Continuing revenue by destination (2013)
Continuing revenue by destination (2014)
SECTION 2 – RESULTS FOR THE YEAR
Continued
Emerging
Markets
32%
Emerging
Markets
29%
North America
19%
Western Europe
38%
Rest of the
World
5%
Rest of the
World
6%
UK
6%
UK
6%
North America
19%
Western Europe
40%
The following table shows a geographical analysis of how the Group’s revenue is derived by destination.
Continuing
Continuing
Segmental
Segmental
Discontinued
Revenue
Revenue Operations
Total
2014
2013
2013
2013
£m
£m
£m
£m
UK
98
104
38
142
Germany
235
247
23
270
Other Western Europe
409
439
30
469
Western Europe
644
686
53
739
USA
300
314
346
660
Canada
18
24
7
31
North America
318
338
353
691
Emerging Markets
544
504
60
564
Rest of World
82
112
7
119
Total segmental revenue
1,686
1,744
511
2,255
Reversal of economic hedge contract losses/(gains)
6
(1)
-
(1)
Total
1,692
1,743
511
2,254


